File list
This special page shows all uploaded files.
| Date | Name | Thumbnail | Size | Description | Versions |
|---|---|---|---|---|---|
| 09:31, 27 October 2017 | Holin-Endolysin-NrtA REcheck.png (file) |  |
62 KB | 1 | |
| 17:18, 27 October 2017 | T--NYMU-Taipei—Holin-Endolysin-REcheck.png (file) | 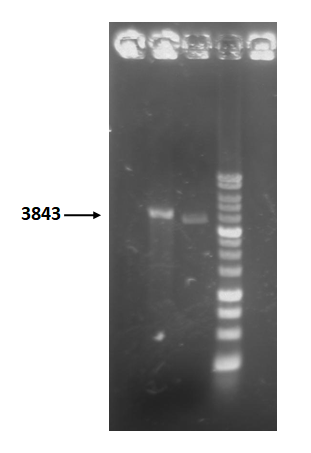 |
56 KB | This figure is restriction enzyme check electrophoresis result of holin-endolysin construct. The marker is 1kb. We use XmaI to digest the sample. The total length is 3843bp as expected. | 1 |
| 02:25, 28 October 2017 | T--NYMU-Taipei--TAS-FunctionalTest.png (file) | 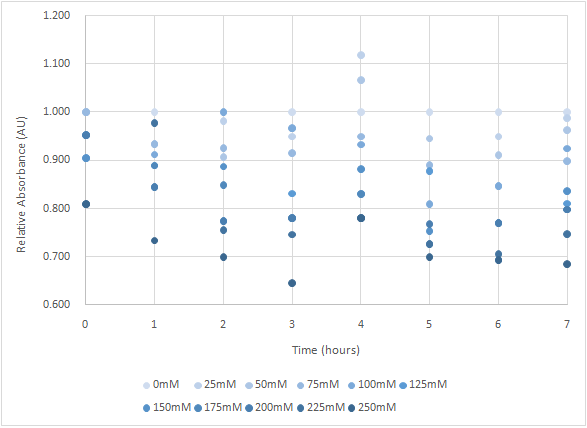 |
16 KB | The figure shows that the trend of the relative absorbance is downward as the lactose is added to induce the suicide mechanism. The concentration of lactose is also positively correlated with the declining degree of relative absorbance. | 1 |
| 05:25, 28 October 2017 | T--NYMU-Taipei--Endolysin.png (file) |  |
37 KB | This figure is the gene map of T4 endolysin construct, pSB1C3-K737007-K112806. | 1 |
| 05:27, 28 October 2017 | T--NYMU-Taipei--Endolysin PCR 514bp.png (file) |  |
81 KB | This figure is electrophoresis result of endolysin (from BBa_K112806) PCR product. The marker is 100bp. The length is 514bp as expected. | 1 |
| 05:28, 28 October 2017 | T--NYMU-Taipei--Endolysin BB PCR 2268bp.png (file) |  |
122 KB | This figure is electrophoresis result of endolysin backbone (from BBa_K737007) PCR product. The marker is 100bp. The length is 2268bp as expected. | 1 |
| 05:40, 28 October 2017 | T--NYMU-Taipei--Holin.png (file) | 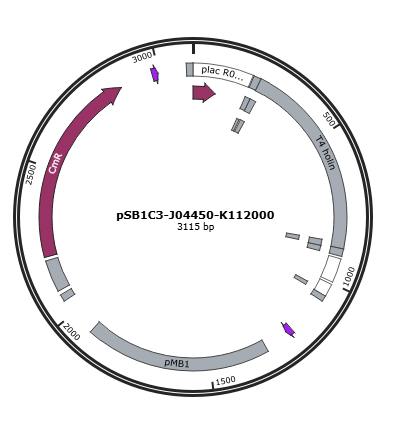 |
38 KB | This figure is the gene map of T4 holin construct, pSB1C3-J04450-K112000. | 1 |
| 05:41, 28 October 2017 | T--NYMU-Taipei--Holin PCR 657bp.png (file) | 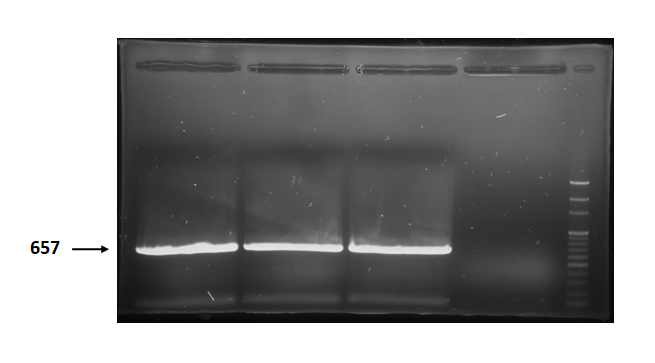 |
100 KB | The figure is electrophoresis result of holin (from BBa_K112000) PCR product. The marker is 100bp. The length is 657bp as expected. | 1 |
| 05:42, 28 October 2017 | T--NYMU-Taipei--Holin BB PCR 705bp.png (file) |  |
70 KB | The figure is electrophoresis result of holin backbone (from BBa_J04450) PCR product. The marker is 1kb. The length is 705bp as expected. | 1 |
| 05:50, 28 October 2017 | T--NYMU-Taipei--Holin-Endolysin XmaI.png (file) | 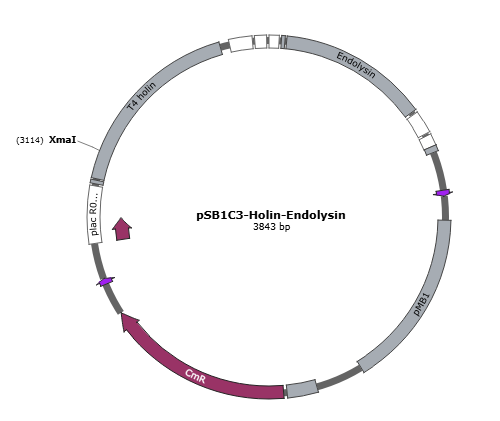 |
24 KB | This figure is the gene map of suicide mechanism construct, pSB1C3- T4 holin- T4 endolysin. | 1 |
| 13:20, 29 October 2017 | T--NYMU-Taipei--Holin BB PCR 2458bp.png (file) | 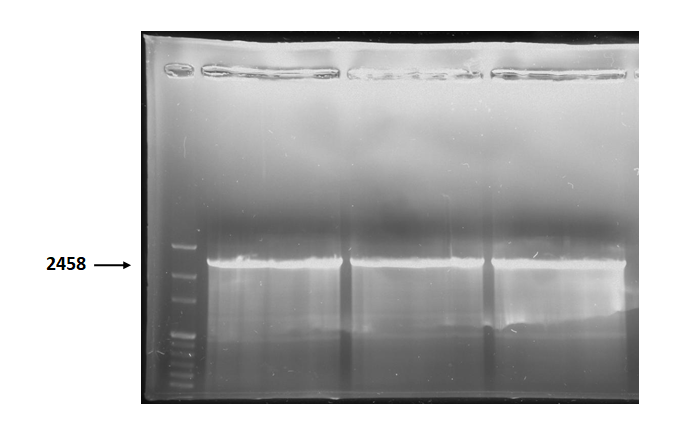 |
154 KB | The figure is electrophoresis result of holin backbone (from BBa_J04450) PCR product. The marker is 1kb. The length is 2458bp as expected. | 1 |
| 10:53, 30 October 2017 | BBa K2350020 LineGraph.png (file) | 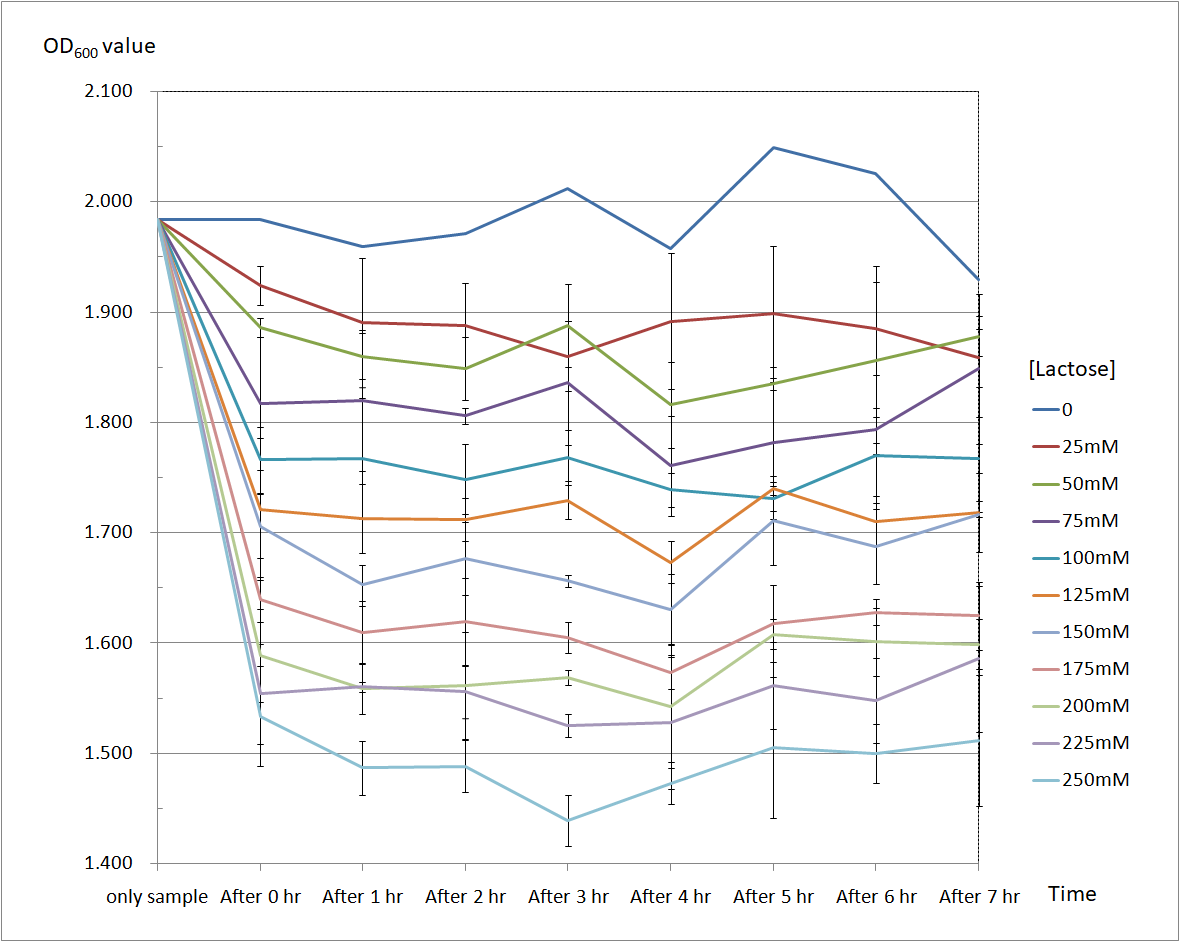 |
86 KB | The line graph presents the general trend of O.D.600 value per hour after lactose is added. As the figure shows, the suicide mechanism is induced immediately when lactose is added into the samples. Besides, we can see that the lactose concentration and... | 4 |
| 12:00, 1 November 2017 | S 6878288491476.png (file) |  |
21 KB | 4 | |
| 12:03, 1 November 2017 | T--NYMU-Taipei--NrtA-abc.jpeg (file) |  |
21 KB | 1 | |
| 12:04, 1 November 2017 | T--NYMU-Taipei--NrtA-ab.jpeg (file) |  |
19 KB | 1 | |
| 12:20, 1 November 2017 | T--NYMU-Taipei--NrtA-Table-1.png (file) |  |
99 KB | 1 |
