File list
This special page shows all uploaded files.
First page |
Previous page |
Next page |
Last page |
| Date | Name | Thumbnail | Size | Description | Versions |
|---|---|---|---|---|---|
| 02:12, 2 November 2017 | T--Kingsborough NY--light dark halloween 0iptg.jpg (file) |  |
1.14 MB | 1 | |
| 02:17, 2 November 2017 | T--Kingsborough NY--light dark halloween 1mMiptg.jpg (file) |  |
1.2 MB | 1 | |
| 18:49, 19 November 2017 | T--Kingsborough NY--J04450 fig1.png (file) |  |
643 KB | J04450 grown in 0 or 1mM IPTG, with either 1% or 3% NaCl, for 1 day | 1 |
| 18:55, 19 November 2017 | T--Kingsborough NY--J04450 fig2.png (file) |  |
18 KB | A graph of the difference in RFP expression levels when bacteria are grown on normal or high salt media. | 1 |
| 18:56, 19 November 2017 | T--Kingsborough NY--J04450 fig3.png (file) |  |
717 KB | Bacteria with part J04450 grown on different media, for different amounts of time | 1 |
| 19:27, 19 November 2017 | T--Kingsborough NY--J04450 fig4.png (file) |  |
732 KB | Bacteria with part J04450, with or without ssrA (tmRNA ribosome rescue component) grown on different media | 1 |
| 19:28, 19 November 2017 | T--Kingsborough NY--RFP ssrA fig1.png (file) |  |
1.33 MB | Bacteria with parts K1399010 - 13, or J04450, with or without ssrA (tmRNA ribosome rescue component) grown on LB Miller with or without 1mM IPTG | 1 |
| 19:29, 19 November 2017 | T--Kingsborough NY--RFP ssrA fig3.png (file) |  |
1.22 MB | Bacteria with parts K1399010 - 13, or J04450, with or without ssrA (tmRNA ribosome rescue component) grown on LB High Salt (3% NaCl) with or without 1mM IPTG | 1 |
| 19:29, 19 November 2017 | T--Kingsborough NY--RFP ssrA fig2.png (file) |  |
16 KB | Quantitation of RFP J04450 grown with 1mM IPTG in either WT E. coli or ssrA::Kan-R E. coli | 1 |
| 00:51, 9 October 2019 | T--Alma--AHLsynthaseExpression1.png (file) |  |
563 KB | A representative gel image for expression of AHL synthases - specifically, parts K204047, K574004, and K1692023. This data shows that it is difficult to detect expression of these genes, despite the fact that another assay demonstrated that they are fu... | 1 |
| 00:56, 9 October 2019 | T--Alma--AHLsynthaseGelDensity1.png (file) |  |
160 KB | A graph showing the densitometry analysis of our SDS PAGE gel | 1 |
| 17:42, 14 October 2019 | T--Alma--universalprimers2019 2.png (file) | 327 KB | A diagram and a representative gel for PCR using universal golden gate primers. | 1 | |
| 17:44, 14 October 2019 | T--Alma--universalprimers2019 3.png (file) |  |
58 KB | A table summarizing the results of various universal primer combinations in a PCR of K515005. | 1 |
| 13:43, 18 October 2019 | T--Alma--sds page1.png (file) |  |
362 KB | An SDS PAGE gel (stained with Coomaise, scanned with Li-COR odyssey Fc) of total soluble and in-soluble protein from bacteria expressing MttB, MttC, MtbA, or a Negative Control. | 1 |
| 13:45, 18 October 2019 | T--Alma--sds page2.png (file) |  |
359 KB | An SDS PAGE gel (stained with Coomaise, scanned with Li-COR odyssey Fc) of fractions from Ni-NTA purification of H6-tagged proteins from BL21 DE3 cells expressing MttB or MttC. F = Flowthrough, W = Wash, E1&2 = Elution 1 and 2, respectively. | 1 |
| 13:46, 18 October 2019 | T--Alma--sds page3.png (file) |  |
362 KB | An SDS PAGE gel (stained with Coomaise, scanned with Li-COR odyssey Fc) of fractions from Ni-NTA purification of H6-tagged proteins from BL21 DE3 cells expressing MtbA or a negative control (empty vector). F = Flowthrough, W = Wash, E1&2 = Elution 1 an... | 1 |
| 14:30, 19 October 2019 | T--Alma--high pH graph1.png (file) |  |
25 KB | Fluorescence/OD Units for RFP production of either the high pH sensor (K2905016) or a control (J04450). Cells were grown to mid-log in LB, then pelleted and transferred to M9 minimal media with pH adjusted to ~4.5 or left untouched at 7, and then grown... | 1 |
| 14:39, 19 October 2019 | T--Alma--K515105 NH4.png (file) |  |
465 KB | Expression and purification of sfGFP from K515105. Whole cell lysates were measured for sfGFP production - as a way to compare and assess the amount of sfGFP produced, this was run alongside an ammonium sulfate cut of the protein. | 1 |
| 16:13, 19 October 2019 | T--Alma--AHLsynthaseFunction1.png (file) | 171 KB | A graph comparing the Fluorescence and OD of a AHL biosensor when incubated with supernatant from AHL producing cells such as K1962014. | 1 | |
| 13:59, 21 October 2019 | T--Alma--readthrough reporter1.png (file) |  |
439 KB | Picture of bacteria from O/N growth on a plate. | 1 |
| 20:40, 21 October 2019 | T--Alma--tag gel1.png (file) |  |
314 KB | A representative SDS PAGE gel for K2905018 in different hosts, alongside densitometery analysis performed with ImageStudio (Li-COR) | 1 |
| 14:05, 27 October 2020 | T--Alma--plate1.png (file) |  |
1.69 MB | A streaked plate for characterization of I13521 | 1 |
| 14:06, 27 October 2020 | T--Alma--plate2.png (file) |  |
2.48 MB | A plate that shows i13521, J04450, or K3445001 in DH5a or HL2483 | 1 |
| 14:07, 27 October 2020 | T--Alma--gel1.png (file) |  |
600 KB | An SDS PAGE gel showing expression of J04450, I13521, K123002, and K3445001 | 1 |
| 14:17, 27 October 2020 | T--Alma--i13521flz.png (file) |  |
37 KB | Fluorescence of i13521 in different conditions | 1 |
| 14:18, 27 October 2020 | T--Alma--plate3.png (file) |  |
1.77 MB | Attempted assembly of K123003 and transformation. Possible cytotoxic effect? | 1 |
| 14:23, 27 October 2020 | T--Alma--Gibson positiveControl.png (file) |  |
1.85 MB | A positive control plate from Gibson assembly | 1 |
| 14:24, 27 October 2020 | T--Alma--K3445001graph.png (file) |  |
19 KB | A graph showing the fluorescence of K3445001 | 1 |
| 16:00, 27 October 2020 | T--Alma--mhplate1.png (file) | 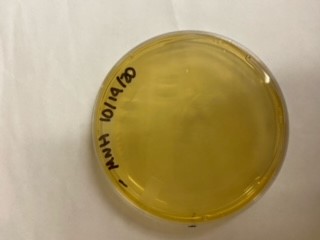 |
10 KB | Transformation (via electroporation) into Vibrio with pSB1C3-BBa_J04450 | 1 |
| 16:01, 27 October 2020 | T--Alma--mhplate2.png (file) | 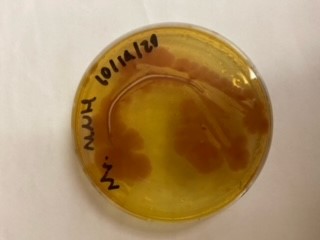 |
12 KB | Transformation in Vibrio of pSB1C3-BBa_K3445002; a C>>T reversion mutation to restore the original pUC19 origin sequence | 1 |
| 16:02, 27 October 2020 | T--Alma--mhplate3.png (file) | 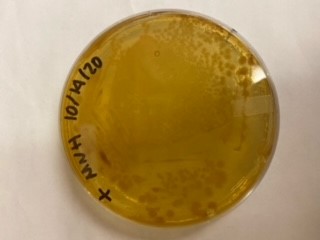 |
12 KB | Transformation in Vibrio of pGGA (a pUC19 origin containing control plasmid, provided by NEB) | 1 |
| 16:02, 27 October 2020 | T--Alma--plot1.png (file) | 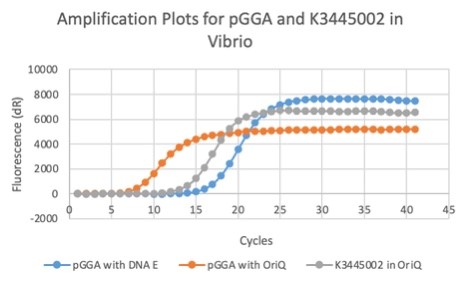 |
25 KB | qPCR results of the plasmid in Vibrio | 1 |
| 16:03, 27 October 2020 | T--Alma--plot2.png (file) | 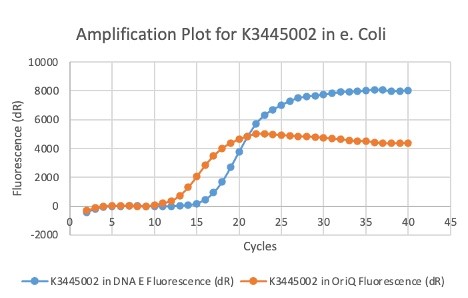 |
28 KB | A qPCR result of K3445002 in E. coli | 1 |
| 16:04, 27 October 2020 | T--Alma--plot3.png (file) | 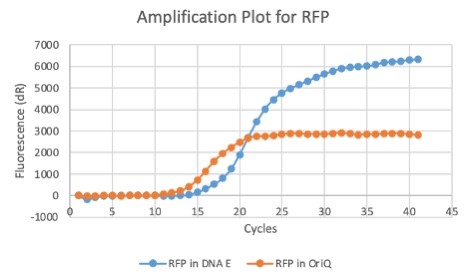 |
23 KB | A qPCR plot of RFP (J04450) in E. coli | 1 |
| 13:26, 21 October 2021 | T--Alma--logATC.png (file) |  |
33 KB | A log scale of ZOI diameter vs. aTc concentration | 1 |
| 13:27, 21 October 2021 | T--Alma--lowATC.png (file) |  |
31 KB | Low concentrations of aTc vs. ZOI diameter | 1 |
| 23:43, 21 October 2021 | T--Alma--plateATC.png (file) |  |
149 KB | An assortment of plates with aTc filter discs | 1 |
| 01:30, 22 October 2021 | T--Alma--RtER qPCR.png (file) |  |
36 KB | Amplification plot for RtER qPCR | 1 |
| 01:41, 22 October 2021 | T--Alma--RtERsdsPAGE.png (file) |  |
202 KB | SDS PAGE results for RtER steady state expression with 1mM IPTG | 1 |
| 00:56, 12 October 2022 | T--Alma--relativebindingER.png (file) |  |
258 KB | Binding of human and rainbow trout estrogen receptor to different ligands, relative to the human protein binding estradiol | 1 |
| 00:58, 12 October 2022 | T--Alma--3UUD5KRA.png (file) |  |
821 KB | Pairwise alignment of 3UUD and 5KRA PDB structures (human estrogen receptor with estradiol or DDT) | 1 |
| 00:59, 12 October 2022 | T--Alma--hERhydro.png (file) |  |
653 KB | Human estrogen receptor bound to DDT (PDB:5KRA), colored by hydrophobicity | 1 |
| 01:12, 12 October 2022 | T--Alma--rtERhydro.png (file) |  |
717 KB | A SWISS-MODEL of Rainbow Trout Estrogen Receptor, colored by hydrophobicity | 1 |
| 01:50, 12 October 2022 | ModelVS5kra.png (file) |  |
1.71 MB | Comparison of the rtER model versus human ER from PDB 5KRA | 1 |
| 02:06, 12 October 2022 | T--Alma--ksQPCR.png (file) |  |
1,003 KB | qPCR data for the kill switch part K4166000 | 1 |
| 02:07, 12 October 2022 | T--Alma--ksPlate.png (file) |  |
2.5 MB | Growth (on a plate) of our Kill Switch part, K4166000 compared to controls K4166001 and K4166010 | 1 |
| 02:09, 12 October 2022 | KsGrowth.png (file) |  |
436 KB | A growth curve of the kill switch part, K4166000, compared to controls K4166001 and K4166014, showing somewhat slower growth for the two replicates of the kill switch. | 1 |
| 02:10, 12 October 2022 | T--Alma--ksGrowth.png (file) |  |
436 KB | Growth curve of part K4166000 and associated controls (K4166001 and K4166014) | 1 |
| 02:43, 12 October 2022 | T--Alma--pcnPlate.png (file) | 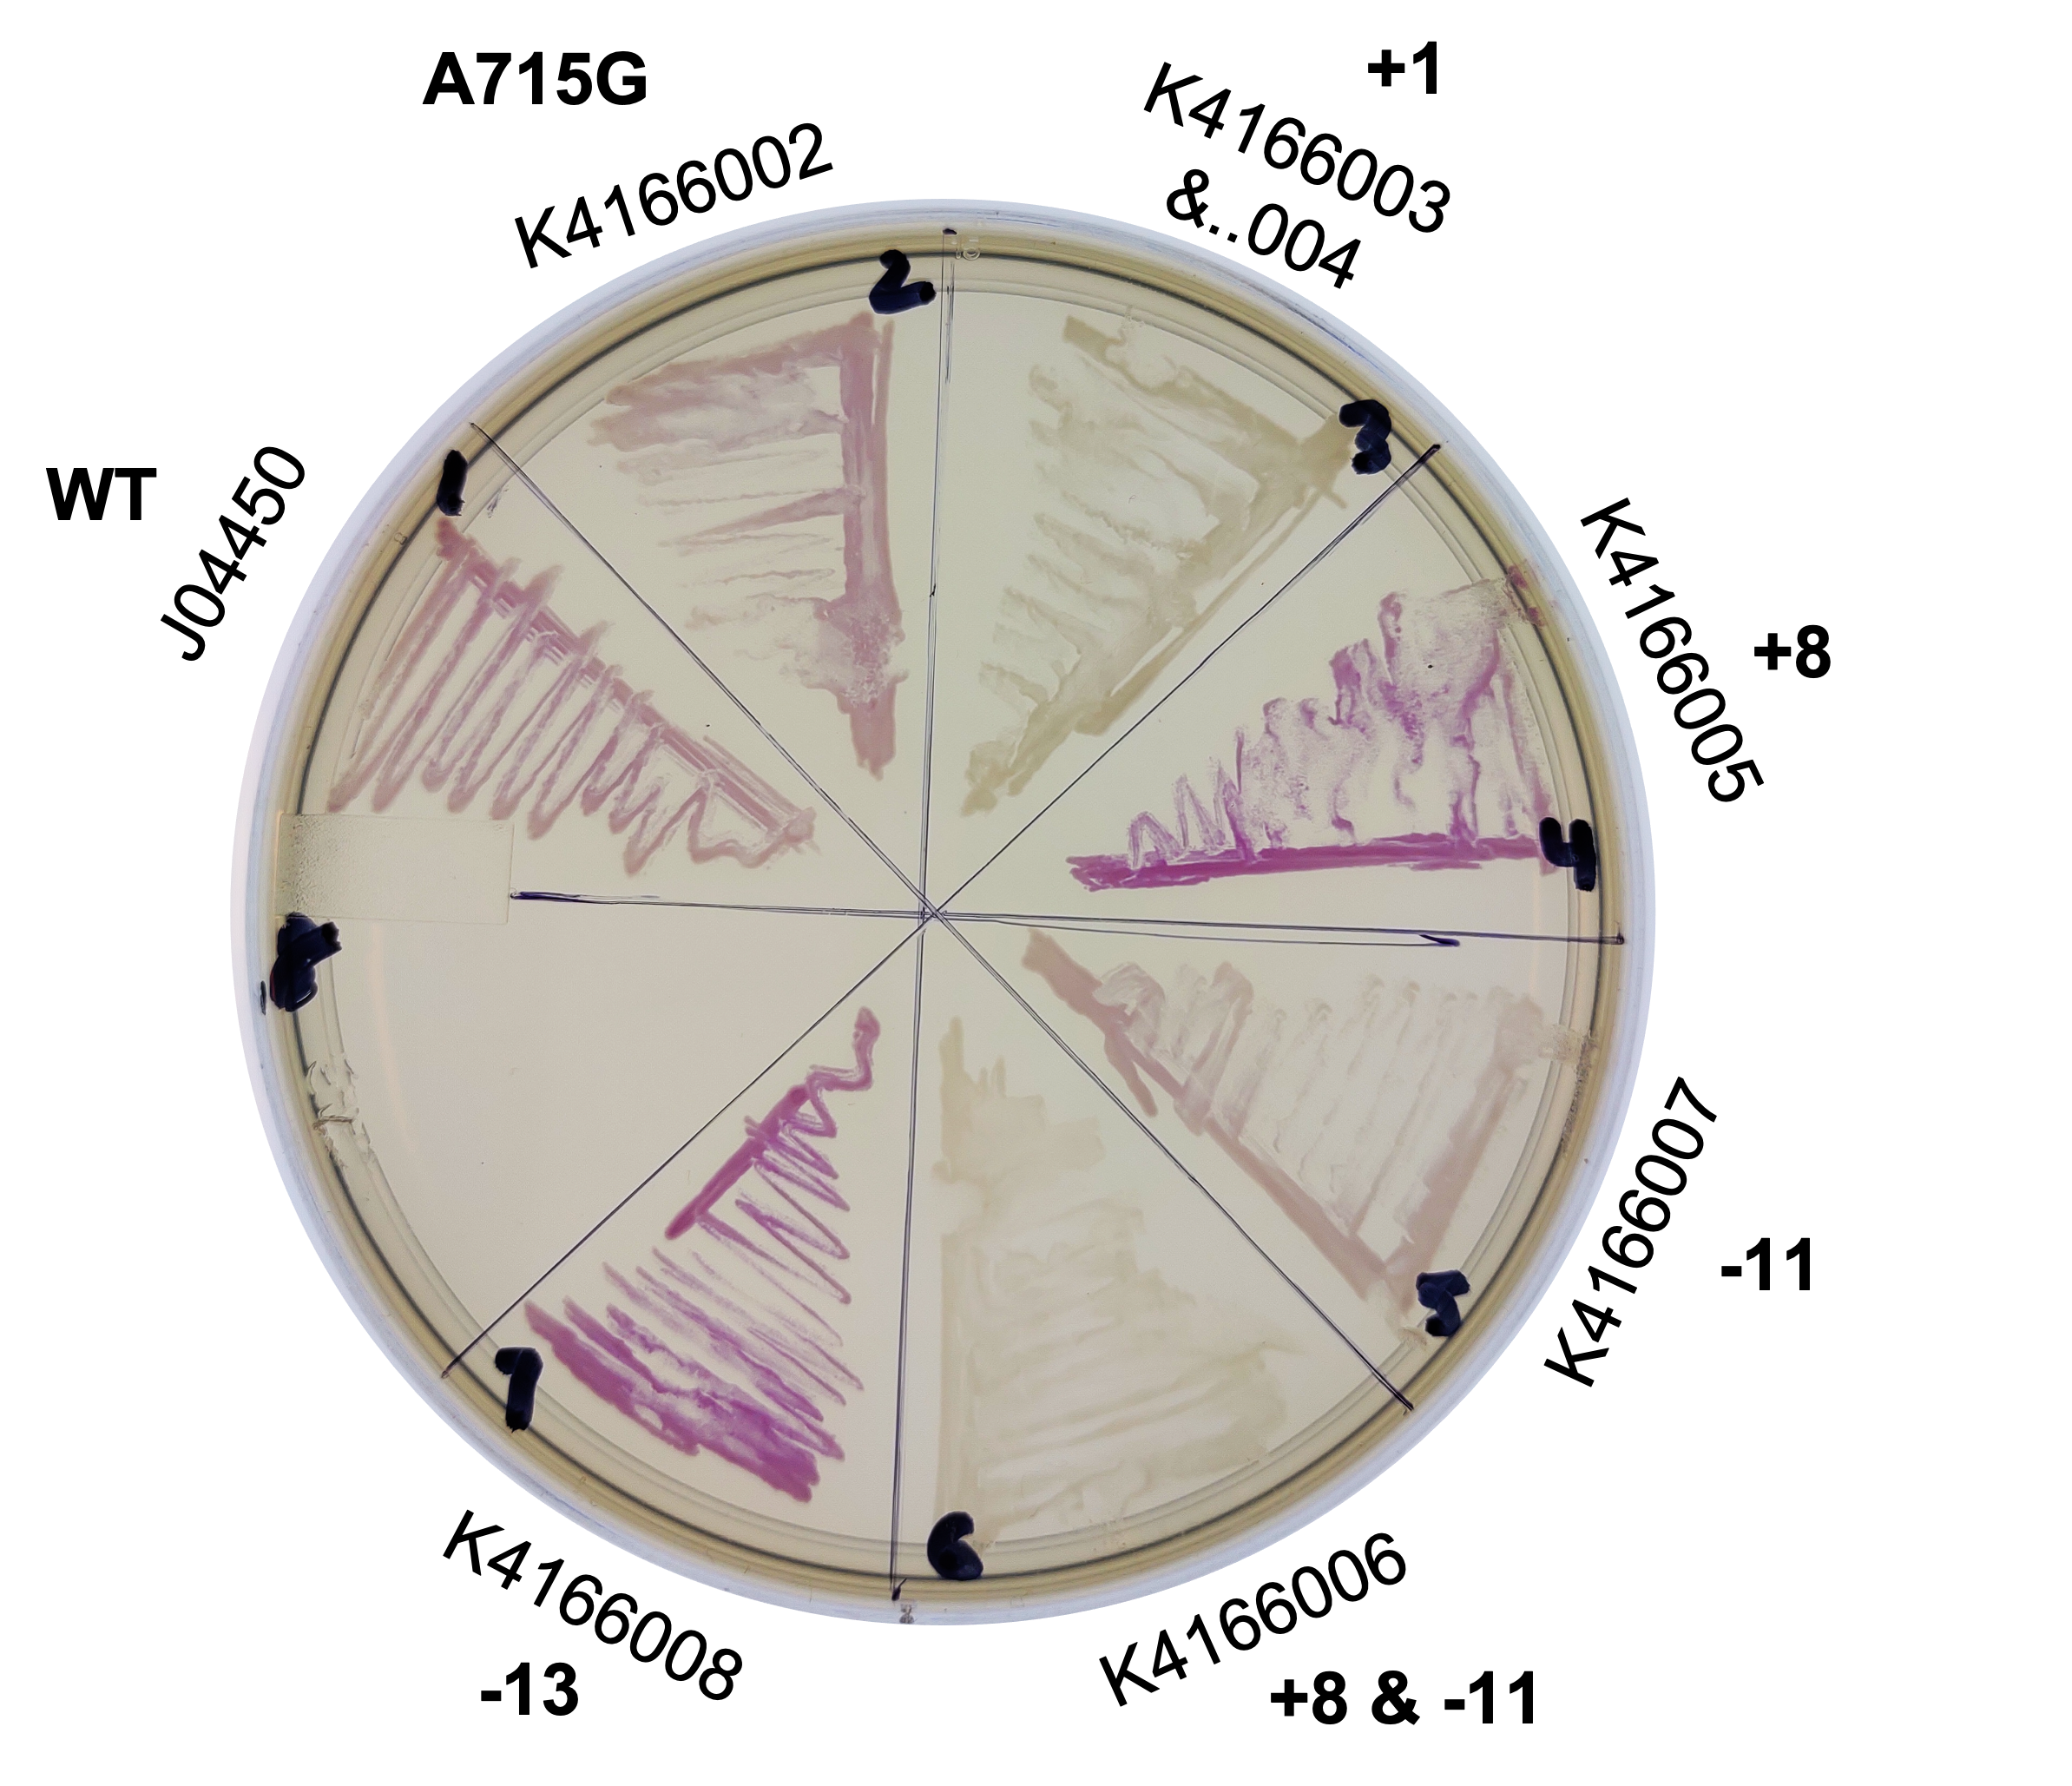 |
4.04 MB | A plate of our different origin of replication mutants streaked onto an LB plate with Chloramphenicol. | 1 |
| 02:50, 12 October 2022 | T--Alma--gel 004.png (file) |  |
316 KB | Plasmid copy number determination for gel electrophoresis | 1 |
First page |
Previous page |
Next page |
Last page |
