
File list
This special page shows all uploaded files.
| Date | Name | Thumbnail | Size | Description | Versions |
|---|---|---|---|---|---|
| 02:08, 22 October 2019 | EGFP SDS-PAGE.png (file) |  |
139 KB | 1 | |
| 02:07, 22 October 2019 | EGFP PLATE.jpeg (file) |  |
28 KB | 1 | |
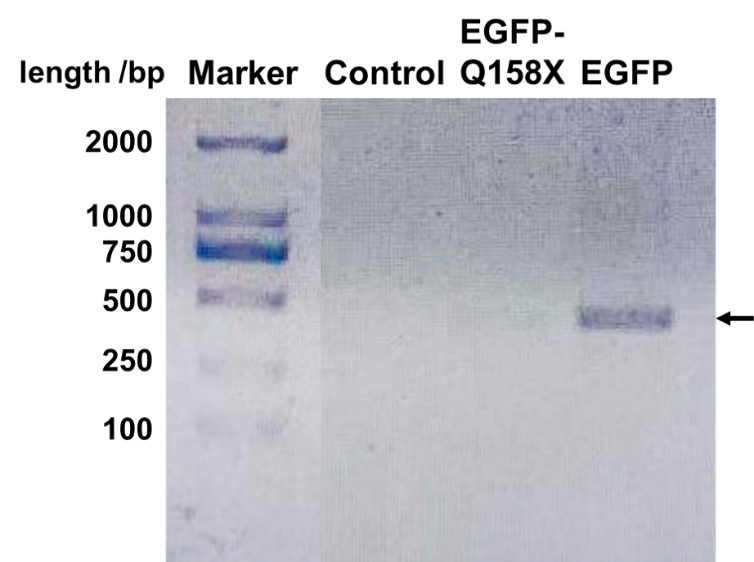
| 02:06, 22 October 2019 | EGFP Mutants DNA.png (file) |  |
467 KB | 1 | |
| 02:06, 22 October 2019 | EGFP Fluorescence Microscope.png (file) |  |
372 KB | 1 | |
| 21:45, 21 October 2019 | ChlR.jpeg (file) |  |
59 KB | 2 | |
| 21:42, 21 October 2019 | Cre+lox Sites.png (file) |  |
56 KB | Reverted to version as of 16:48, 21 October 2019 | 6 |
| 21:32, 21 October 2019 | Cre+lox511.png (file) |  |
370 KB | 1 | |
| 21:14, 21 October 2019 | MCherry and its mutants.png (file) |  |
101 KB | 1 | |
| 21:03, 21 October 2019 | EGFP Mutants.png (file) |  |
83 KB | 1 | |
| 20:52, 21 October 2019 | EGFP with lacIq.tiff (file) | 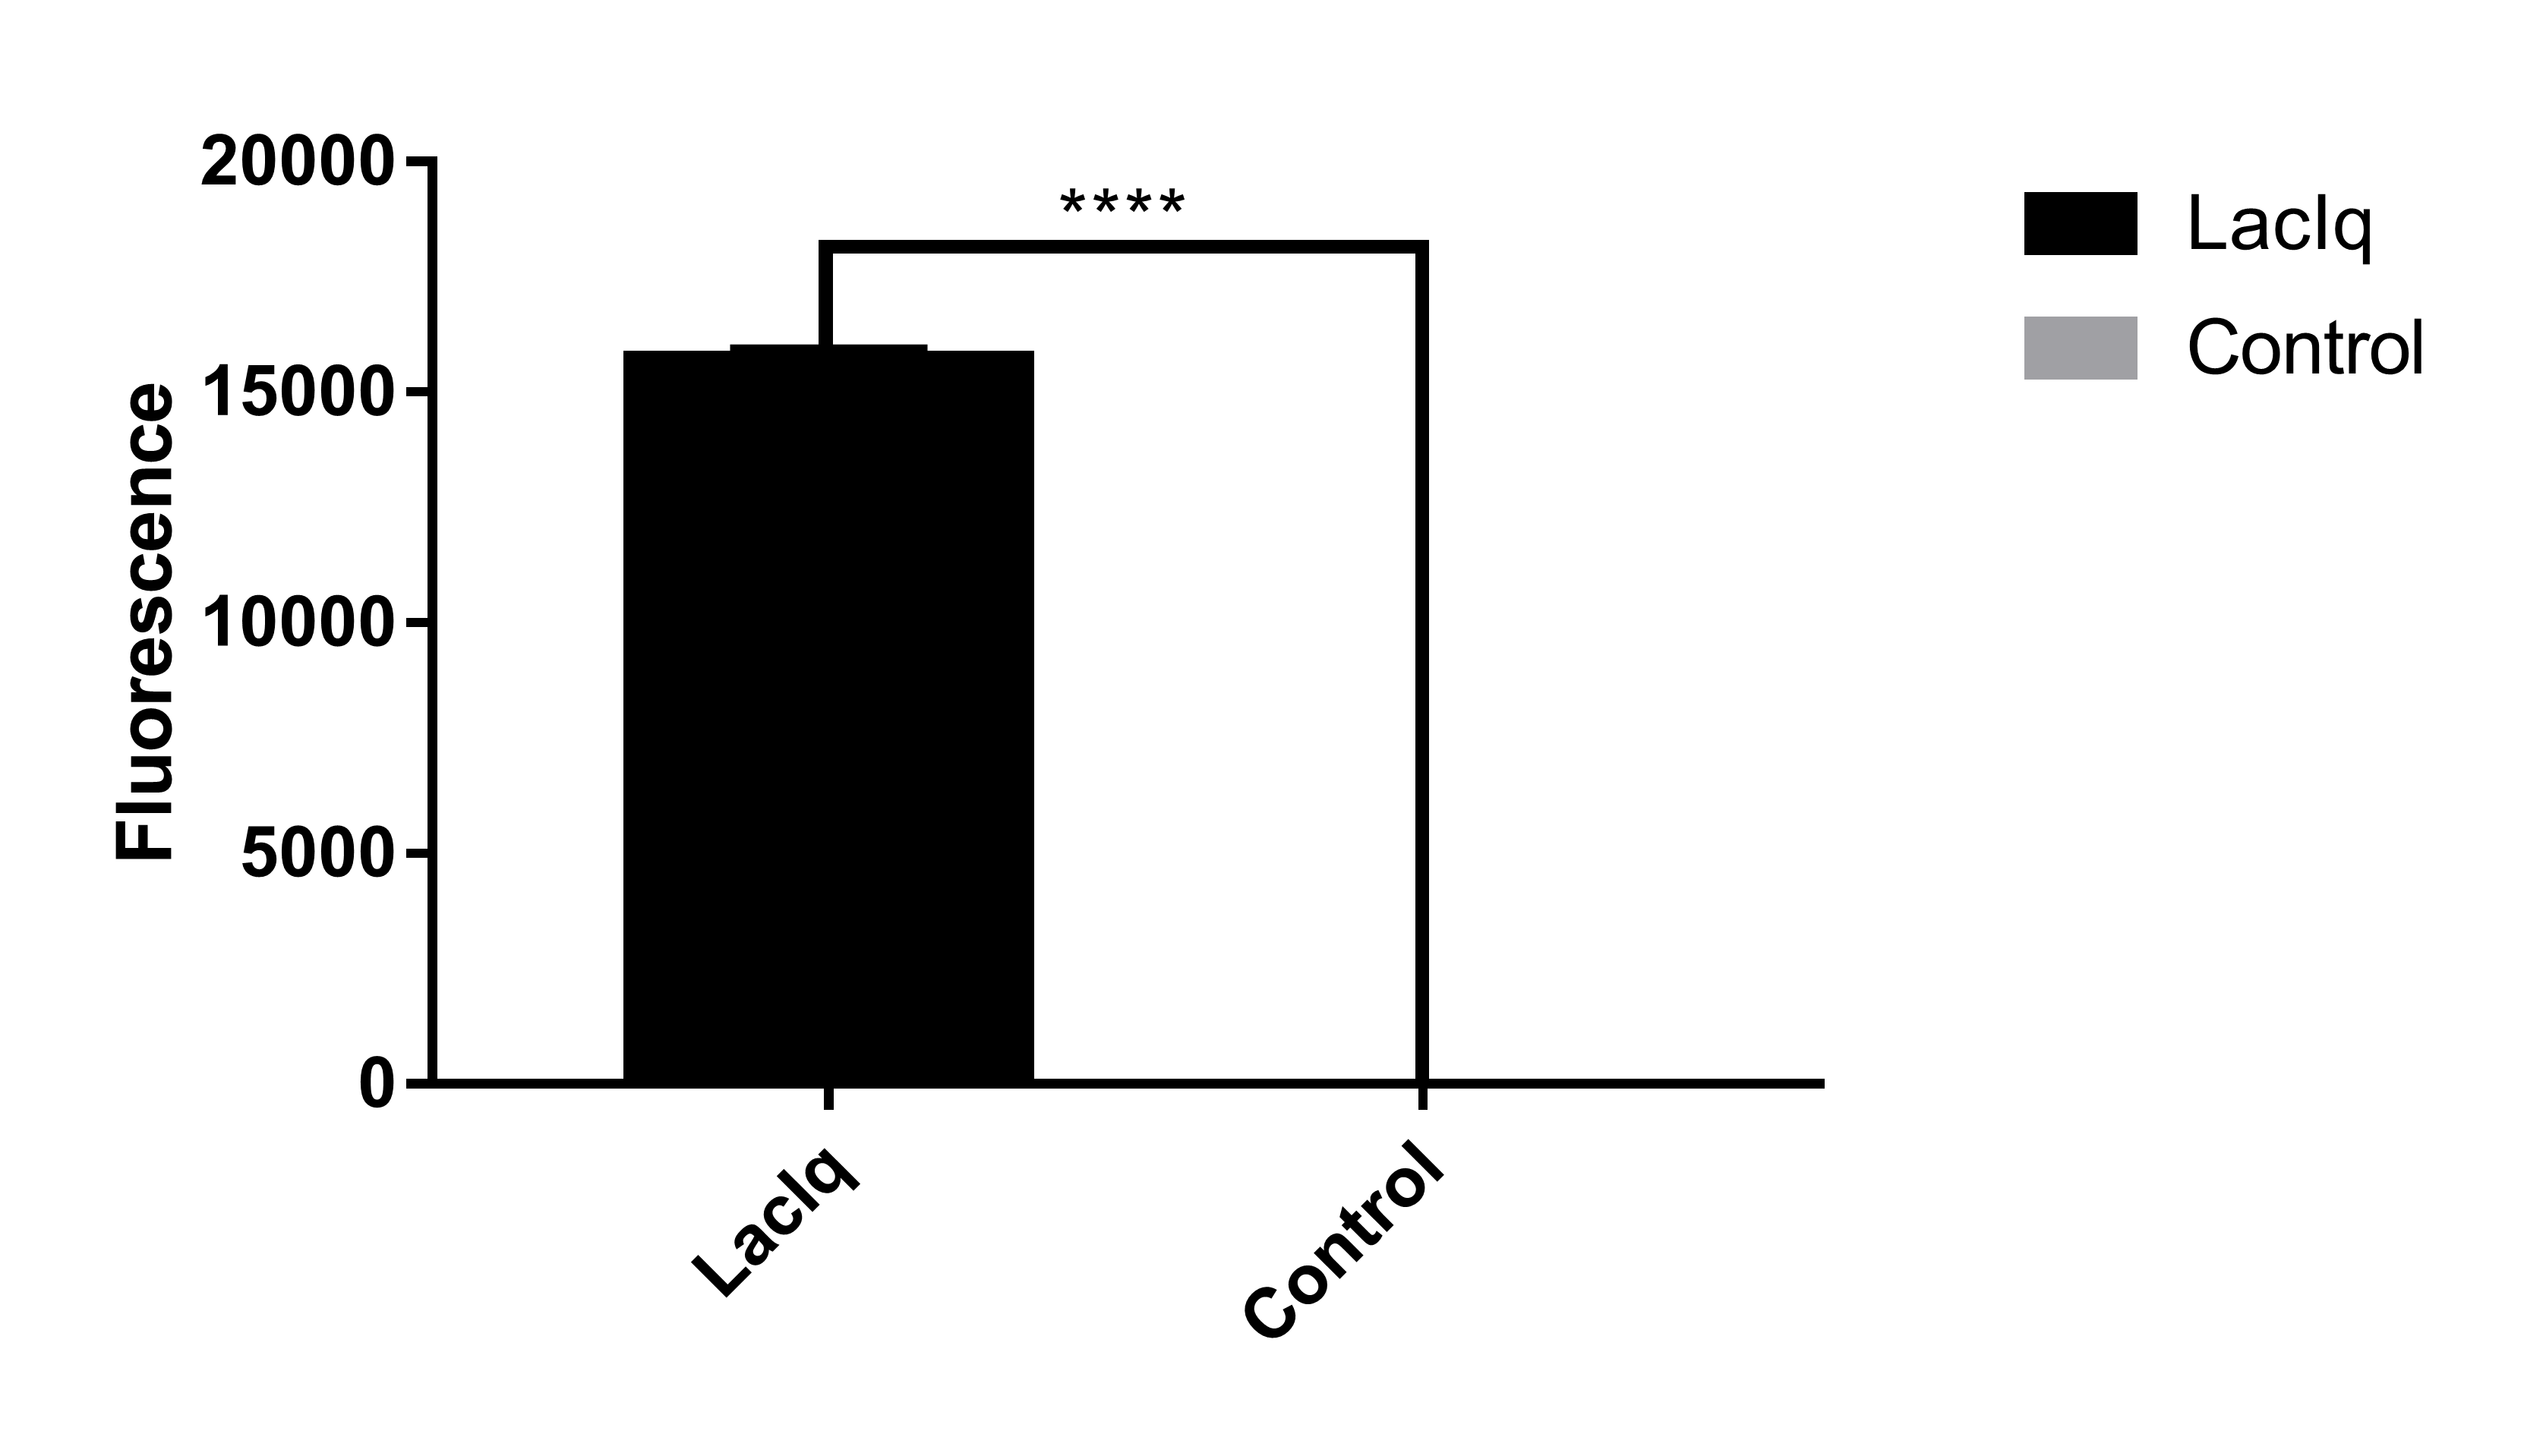 |
98 KB | 2 | |
| 20:45, 21 October 2019 | EGFP with T5.jpeg (file) |  |
85 KB | 2 | |
| 18:32, 21 October 2019 | Gag-pol-sds page.png (file) |  |
263 KB | 1 | |
| 18:23, 21 October 2019 | Gag-pol.png (file) |  |
13 KB | 2 | |
| 16:55, 21 October 2019 | Cre+loxP.png (file) |  |
40 KB | Reverted to version as of 16:51, 21 October 2019 | 4 |
| 10:31, 21 October 2019 | Fluorescence of EGFP.jpeg (file) |  |
70 KB | Figure 2. The relative fluorescence intensity of EGFP measured by 96-well plate reader EGFP represents the relative fluorescence intensity of BL21(DE3) transformed with plasmid encoding EGFP protein. The Negative represents the relative fluorescence in... | 1 |
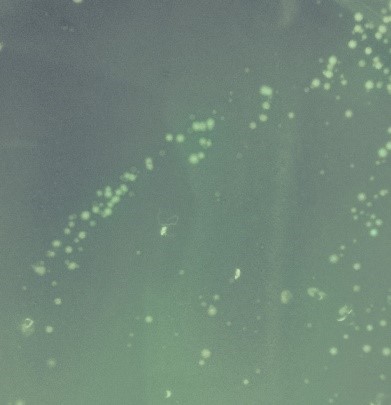
| 10:24, 21 October 2019 | EGFP in liquid bacteria culture.jpeg (file) |  |
67 KB | Figure 1. Bacteria Liquid culture observed by a fluorescence microscope The left side of the photo is bacteria (containing EGFP coding plasmid) liquid culture which appears to be green under excitation while the right side of the photo is empty. From... | 1 |
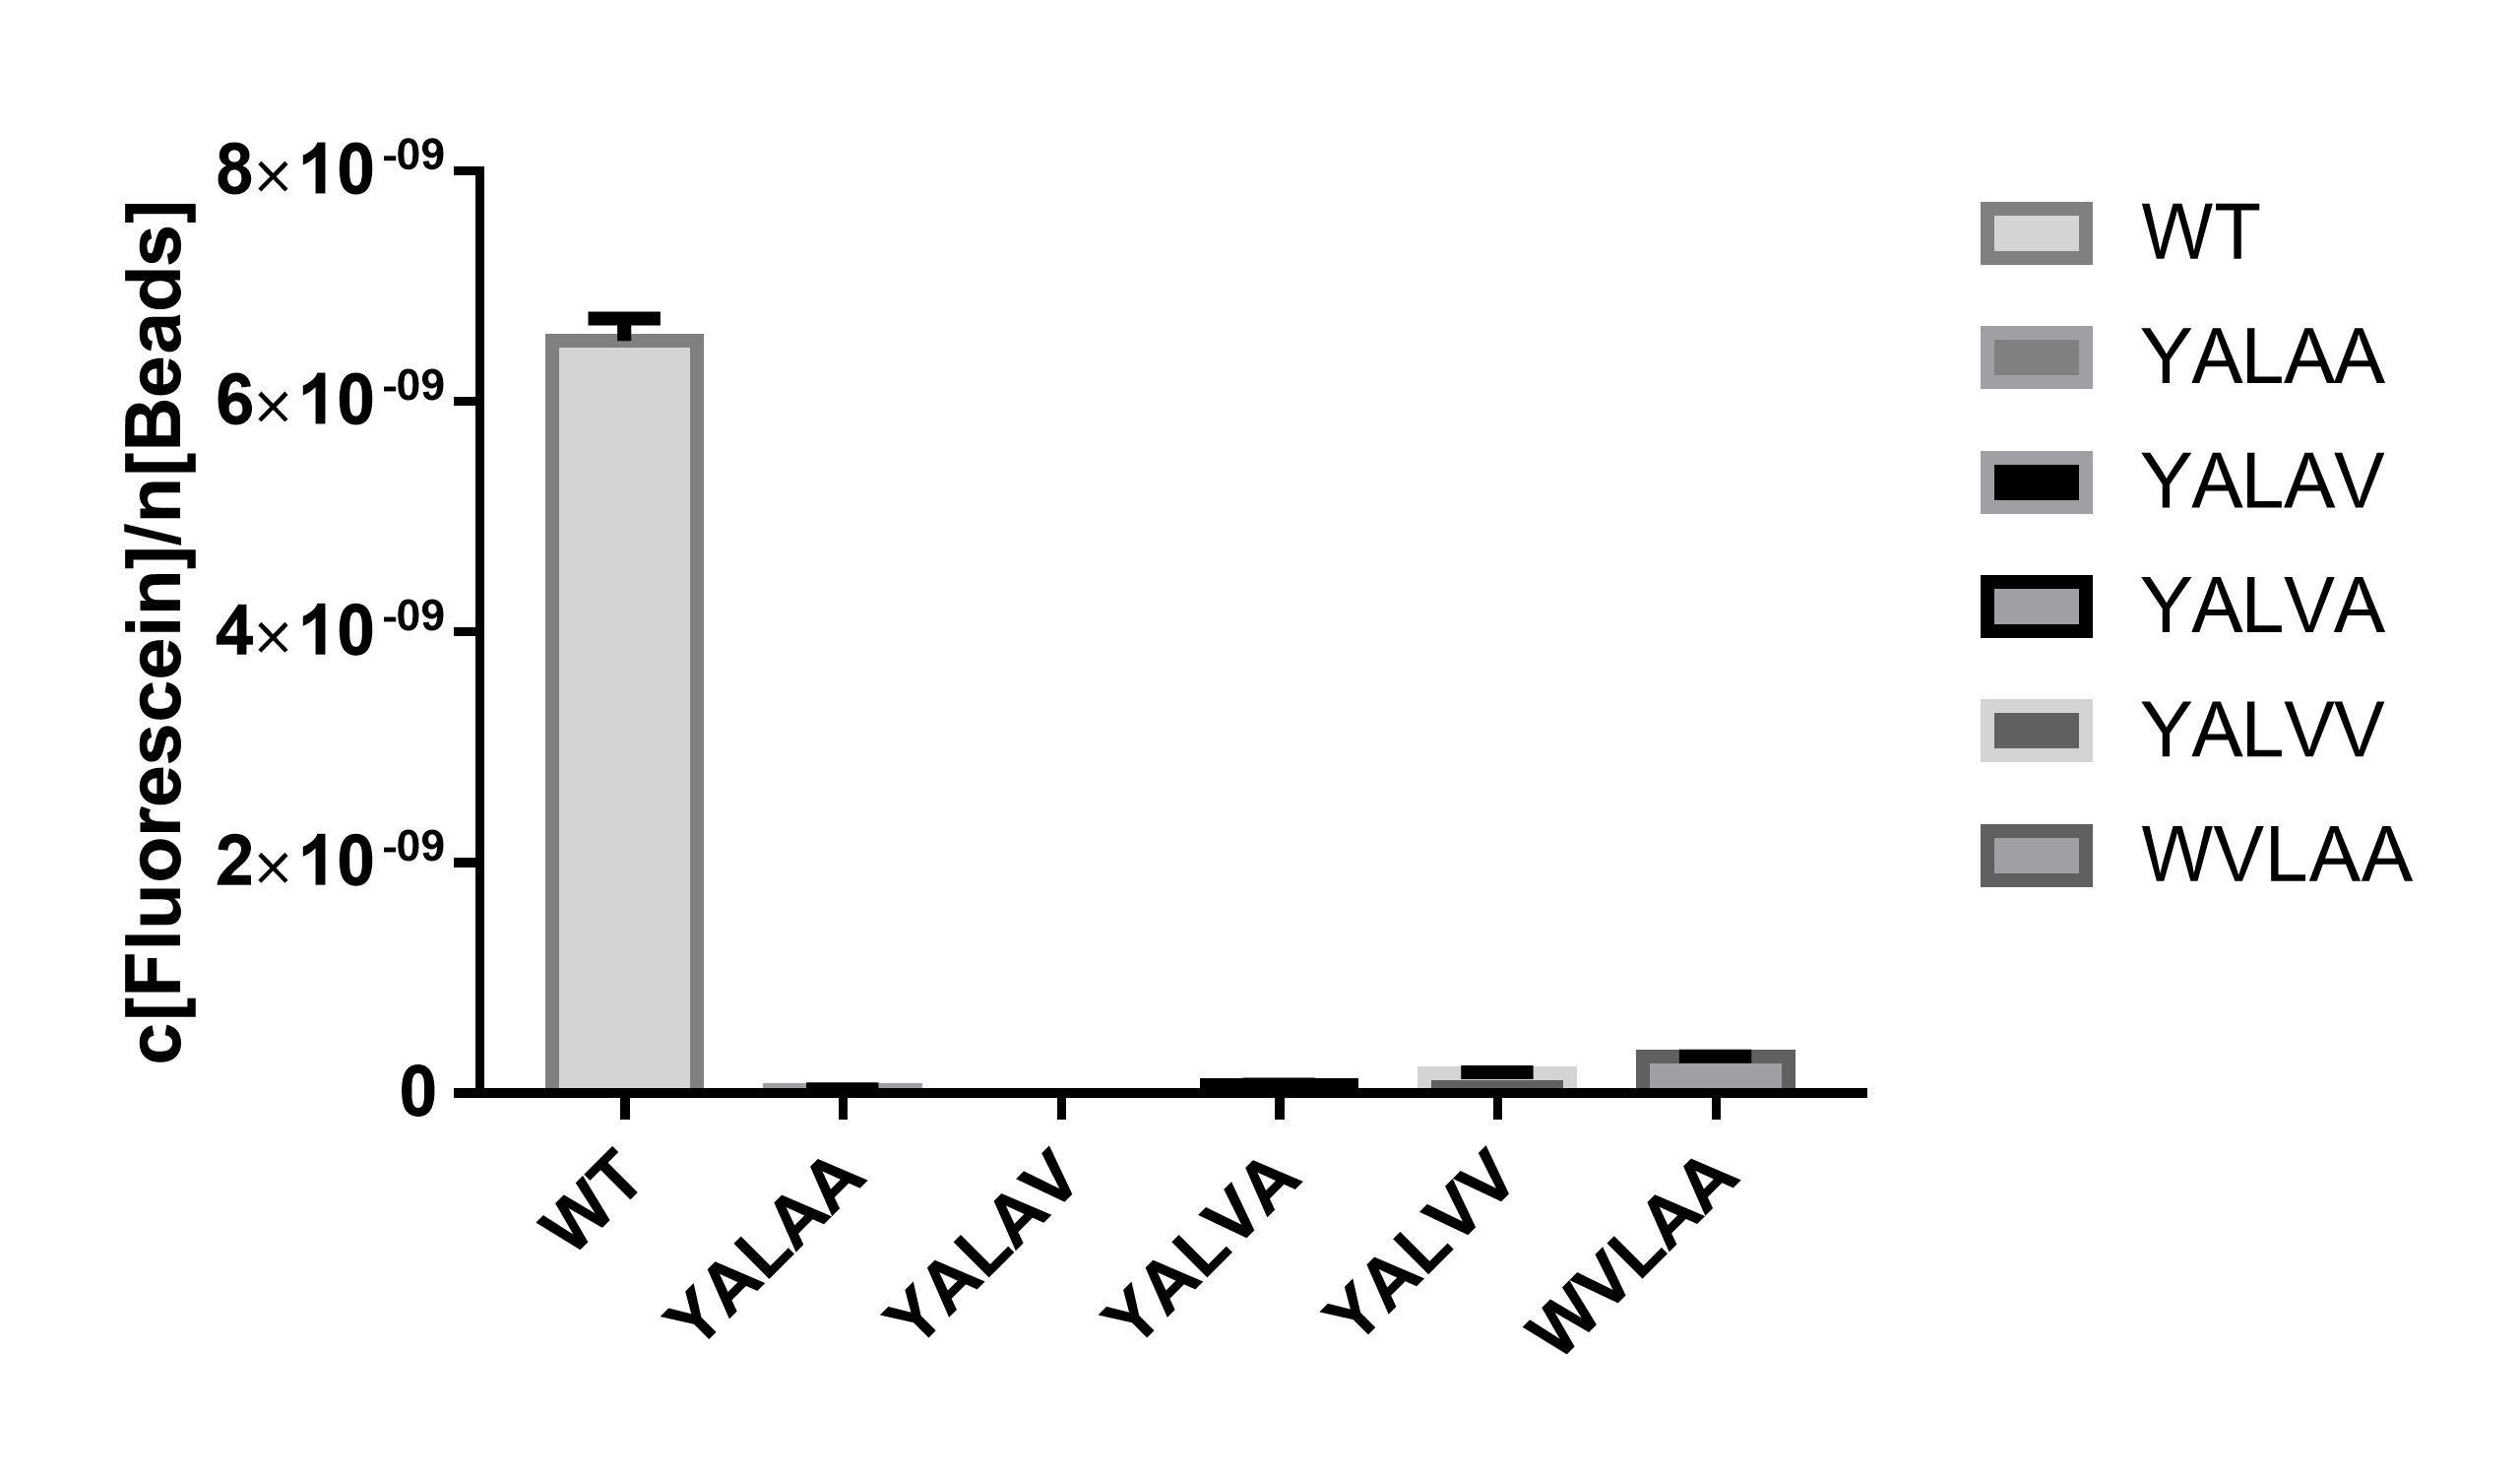
| 03:06, 18 October 2019 | Degradation tags-steady state.png (file) |  |
103 KB | Figure 1. Degradation tag greatly reduces the protein level at stable state. WT represents the positive control of EGFP without any tag attachment. The five degradation tags are represented by their last five amino acid sequence. The vertical axe shows... | 1 |
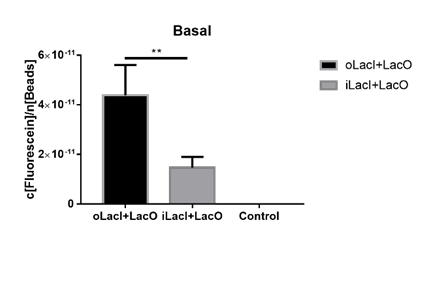
| 11:30, 10 October 2019 | ILacI uninduced.png (file) |  |
16 KB | The basal fluorescence level of EGFP controlled by different repressors. The bar indicates the mean fluorescence level during the 10 h with no inducer in the culture. The fluorescence level is quantified as in Fig. 1. oLacI stands for the wildtype LacI... | 1 |
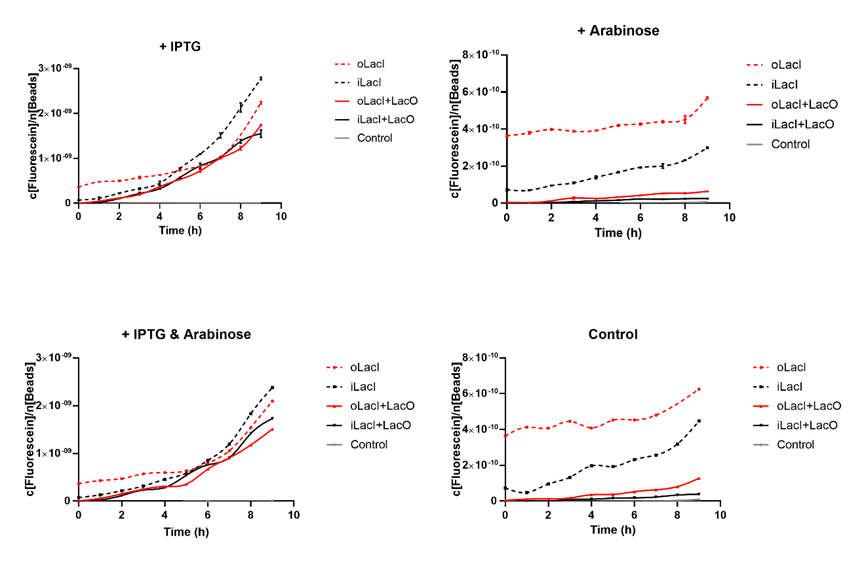
| 11:27, 10 October 2019 | ILacI Curves.png (file) |  |
90 KB | The expression level of EGFP controlled by different versions of LacI and inducers, or under different promoters. The origin point indicates the time when different inducers are added (1 mM IPTG and/or 4 mM Arabinose). The title of the graph shows whic... | 3 |
| 11:25, 10 October 2019 | ILacI+IPTG.png (file) |  |
18 KB | Measurement of the iLacI induced by IPTG | 1 |