
File list
This special page shows all uploaded files.
| Date | Name | Thumbnail | Size | Description | Versions |
|---|---|---|---|---|---|
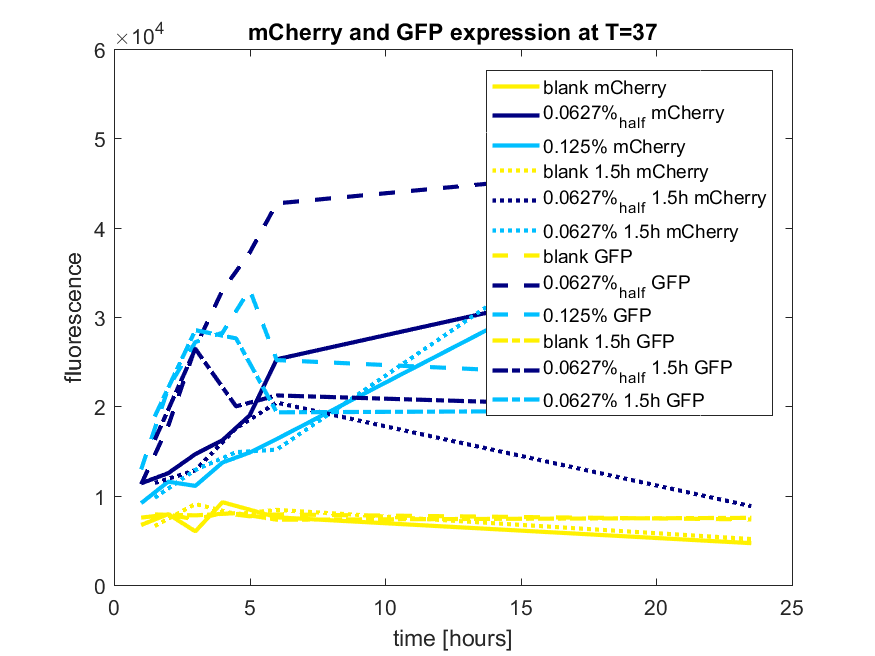
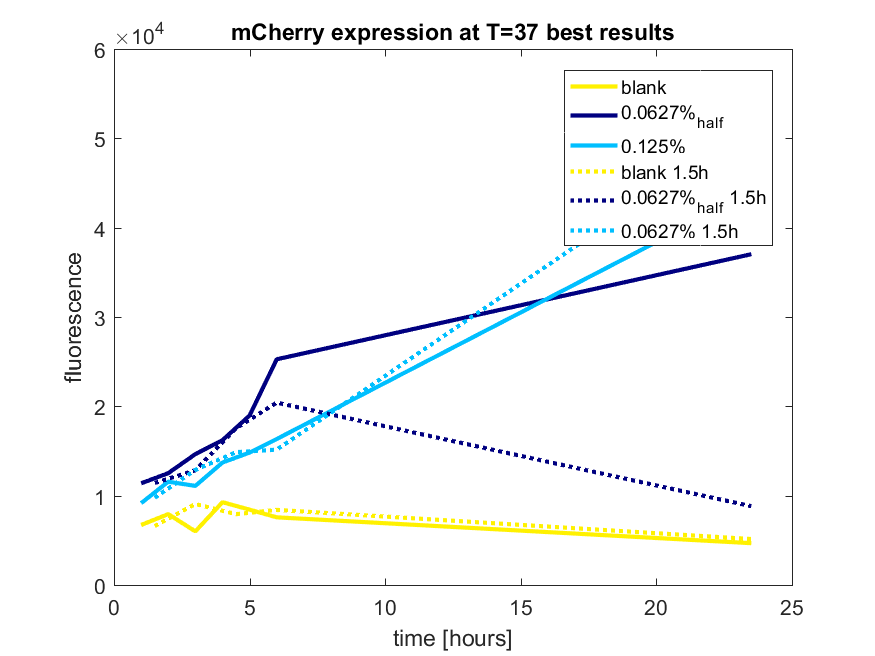
| 12:56, 28 October 2017 | T-TU-Eindhoven--pBAD vector mCherry and GFP best results.png (file) |  |
67 KB | 1 | |
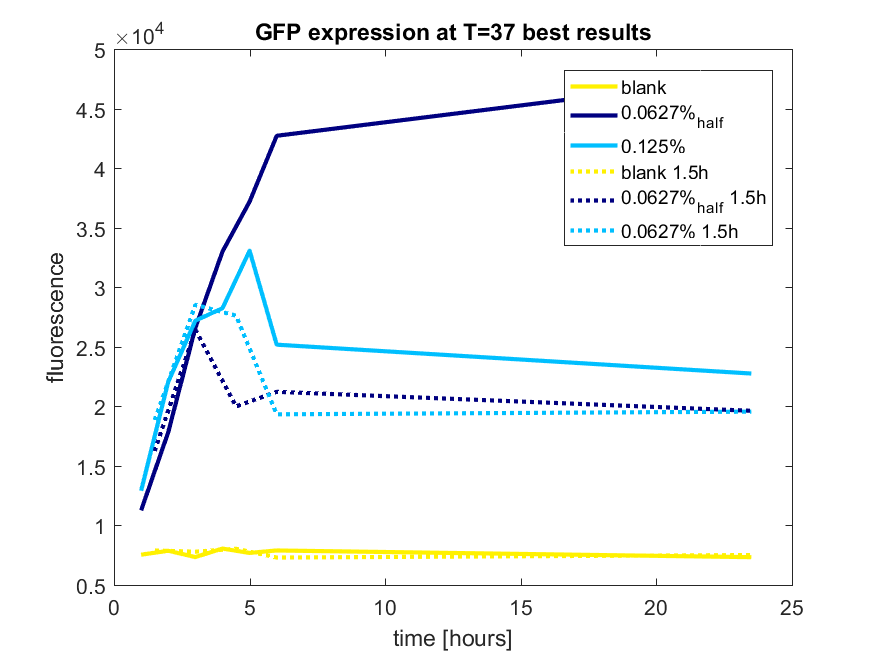
| 12:56, 28 October 2017 | T-TU-Eindhoven--pBAD vector GFP best results.png (file) |  |
42 KB | 1 | |
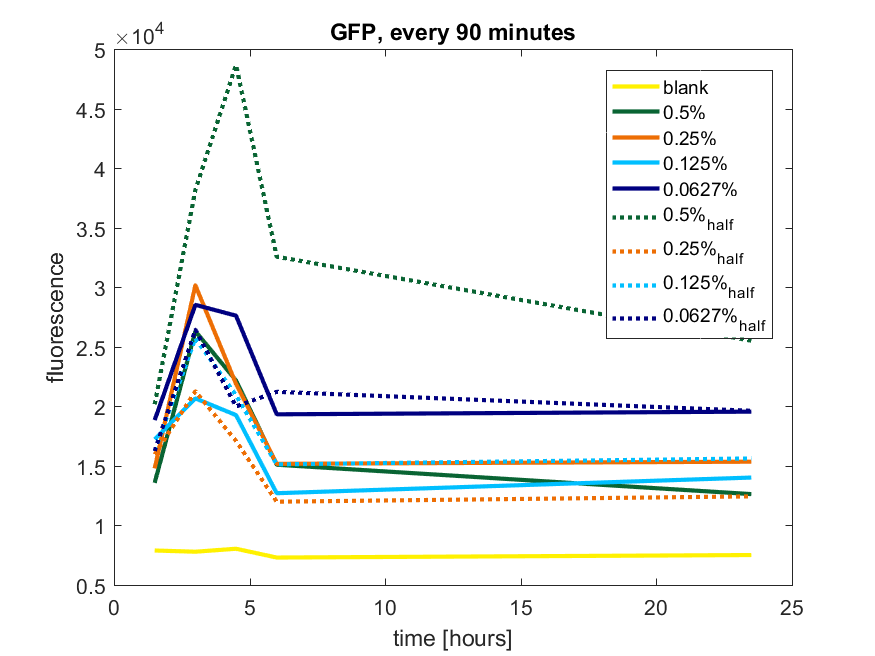
| 12:54, 28 October 2017 | T-TU-Eindhoven--pBAD vector GFP 90min.png (file) |  |
54 KB | 1 | |
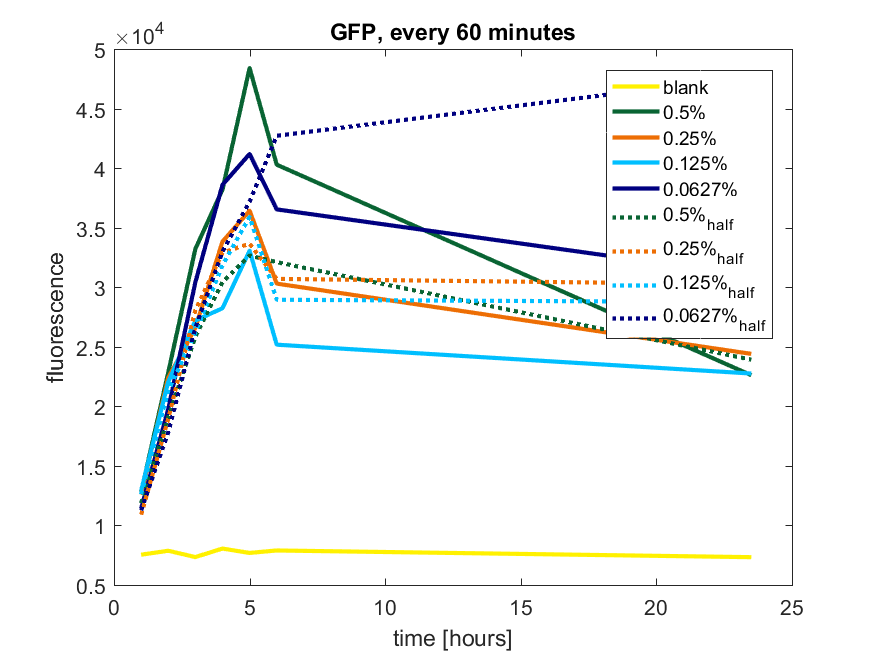
| 12:54, 28 October 2017 | T-TU-Eindhoven--pBAD vector GFP 60min.png (file) |  |
58 KB | 1 | |
| 12:42, 28 October 2017 | T-TU-Eindhoven--pBAD vector mCherry best results.png (file) |  |
41 KB | 1 | |
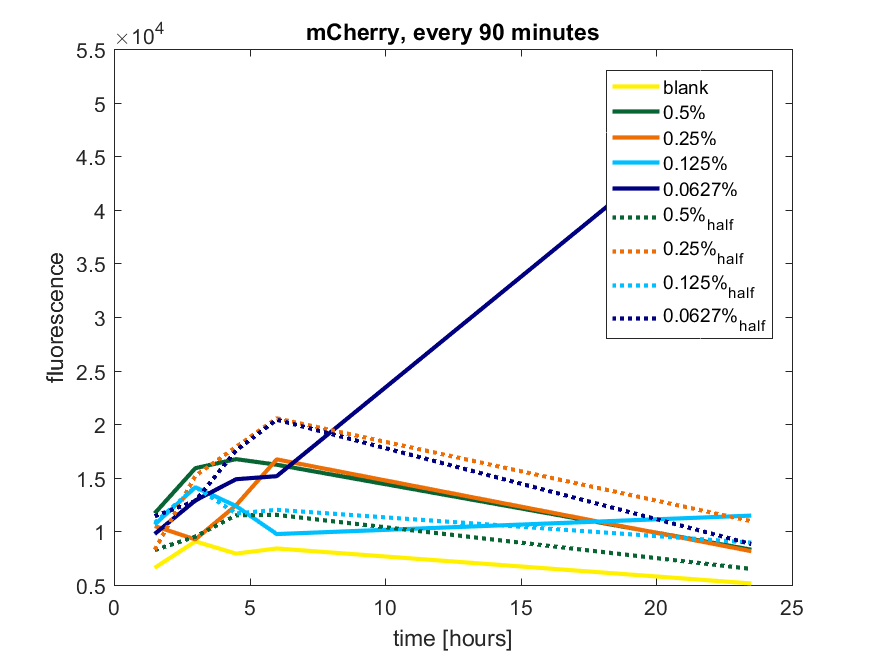
| 12:41, 28 October 2017 | T-TU-Eindhoven--pBAD vector mCherry 90min.png (file) |  |
52 KB | 1 | |
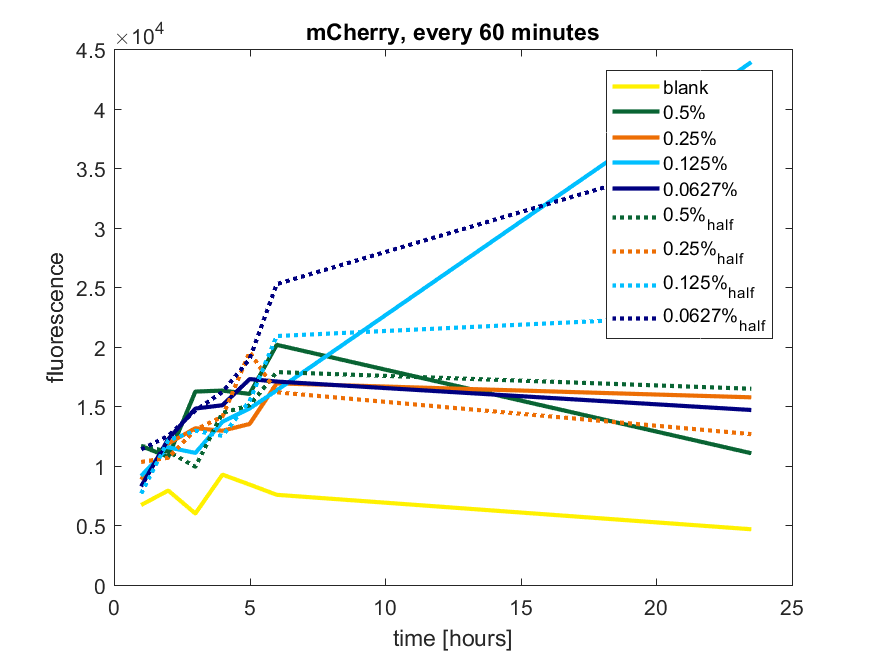
| 12:40, 28 October 2017 | T-TU-Eindhoven--pBAD vector mCherry 60min.png (file) |  |
53 KB | 1 | |
| 12:29, 28 October 2017 | T--TU-Eindhoven--pBAD vector GFP best results.png (file) |  |
42 KB | Results of expression by addition of arabinose | 1 |
| 23:26, 18 September 2015 | TU Eindhoven mNeonGreen Safire2.png (file) |  |
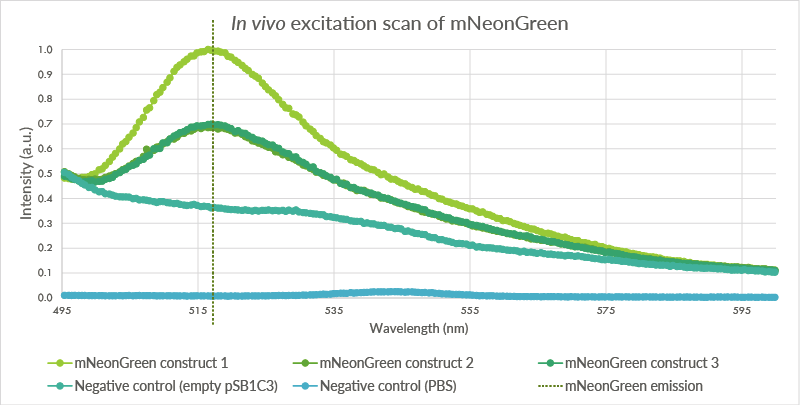
72 KB | The data for the three biological replicates shows high intensity peaks at approximately 517 nm. Three technical replicates for each of the biological replicates were measured. The average of these three technical replicates was used for the shown spectra | 1 |
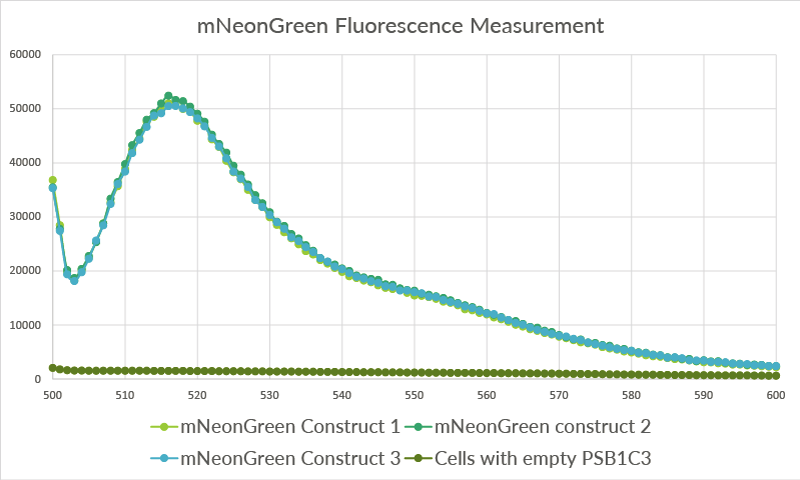
| 23:26, 18 September 2015 | TU Eindhoven mNeonGreen Construct3.png (file) |  |
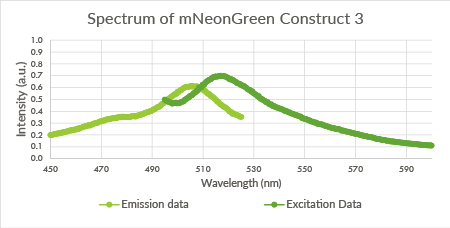
16 KB | Spectrum of mNeonGreen and constitutive promotor J23101, Construct 3. | 1 |
| 23:25, 18 September 2015 | TU Eindhoven mNeonGreen Construct2.png (file) |  |
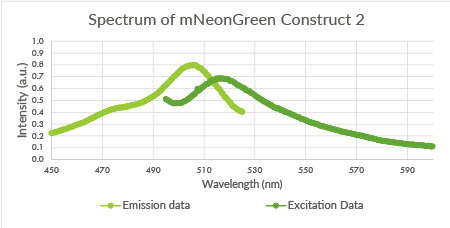
17 KB | Spectrum of mNeonGreen and constitutive promotor J23101, Construct 2. | 1 |
| 23:25, 18 September 2015 | TU Eindhoven mNeonGreen Construct1.png (file) |  |
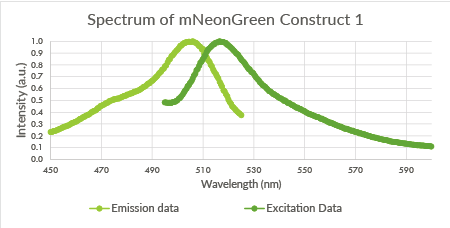
18 KB | Spectrum of mNeonGreen and constitutive promotor J23101, Construct 1. | 1 |
| 23:23, 18 September 2015 | TU Eindhoven mNeonGreen EmissionScan.png (file) |  |
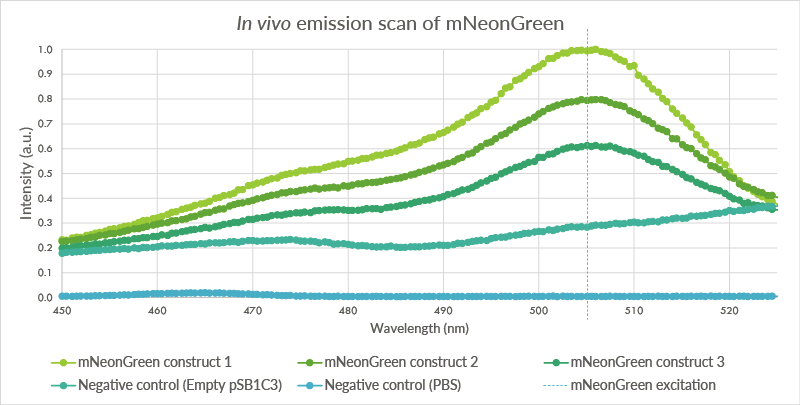
64 KB | An in vivo emissions scan was conducted for mNeonGreen in the BL21(DE3) cells. The cells containing mNeonGreen show a peak at 506 nm. The first negative control, BL21(DE3) cells with the empty pSB1C3 plasmid do not show such a peak. The second negative co | 1 |
| 23:23, 18 September 2015 | TU Eindhoven mNeonGreen ExcitationScan.png (file) |  |
53 KB | The pSB1C3 vector containing mNeonGreen vector was transformed into BL21(DE3) cells. These cells were measured at an OD of 2.0. Three biological triplicates were obtained which all showed peaks at approximately 517 nm. The first negative control, cells wi | 1 |
| 20:02, 18 September 2015 | TU Eindhoven mNeonGreen SnapGene.png (file) |  |
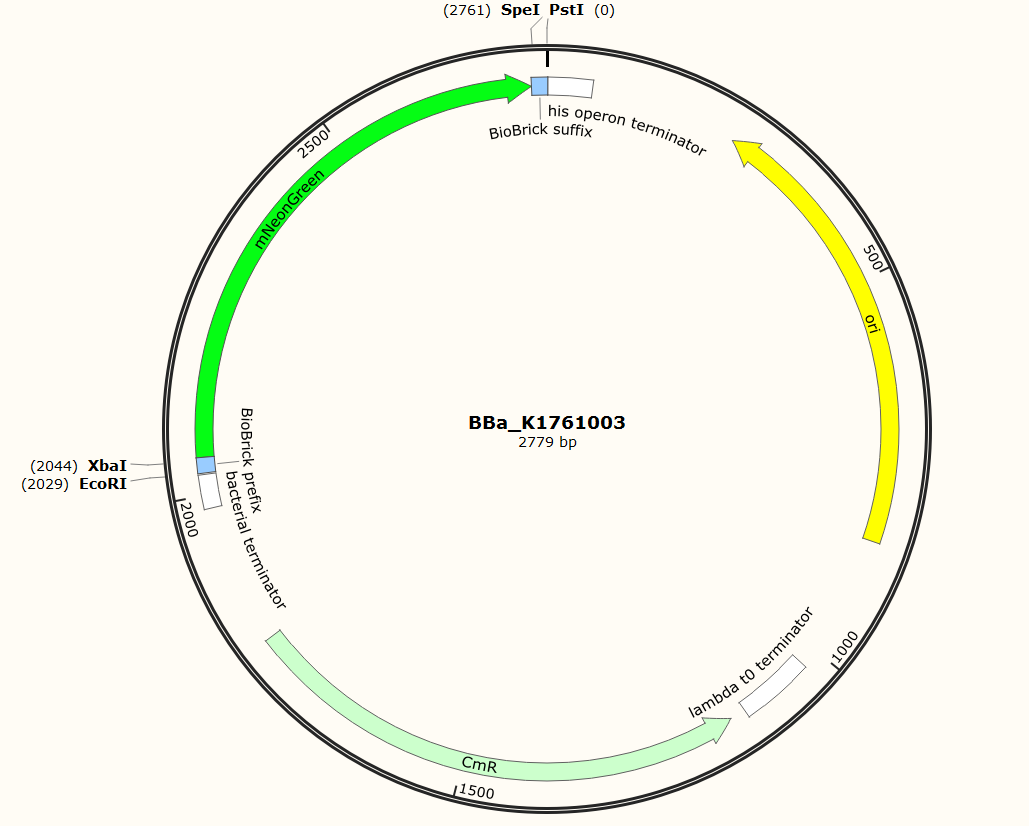
107 KB | Snapgene plasmid overview of the BioBrick part BBa_K1761003. It shows the pSB1C3 vector with the prefix (containing the restriction sites EcoRI and XbaI), mNeonGreen and the suffix (containting the restiction sites SpeI and PstI). | 1 |
| 19:31, 18 September 2015 | TU Eindhoven results bioluminiscence neongreen and NanoLuc.png (file) |  |
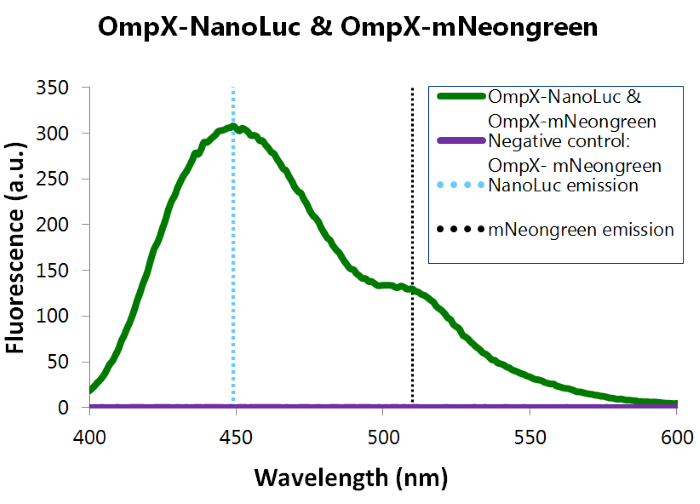
86 KB | OmpX-NanoLuc's & OmpX-mNeonGreen's presence in the cells were tested by adding Nano-Glo substrate to the cells and measuring bioluminescence with the spectrophotometer. The figure below shows that OmpX-NanoLuc shows a peak characteristic for NanoLuc, indi | 1 |
| 06:55, 18 September 2015 | TU Eindhoven Results NanoBit bioluminescence.png (file) |  |
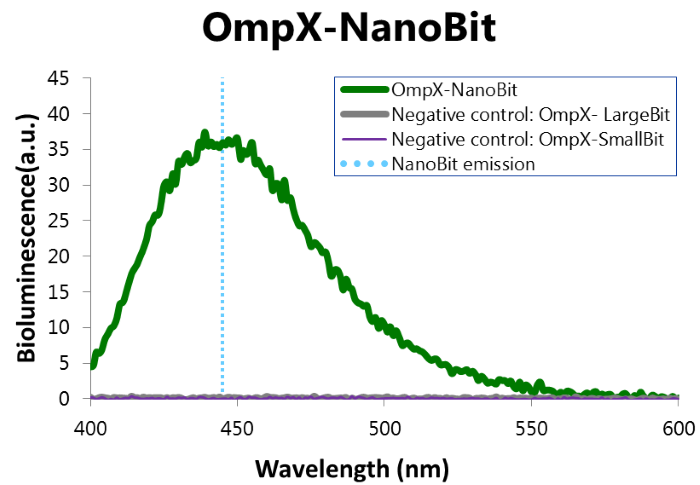
79 KB | Bioluminescence of results of the NanoBit construct. | 1 |
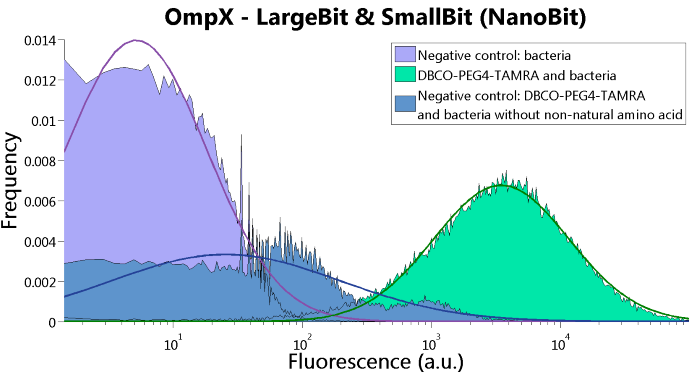
| 06:50, 18 September 2015 | TU Eindhoven FACS OmpX NanoBit.png (file) |  |
54 KB | FACS results of the OmpX - LargeBit construct and the OmpX - SmallBit construct, together NanoBit. | 1 |
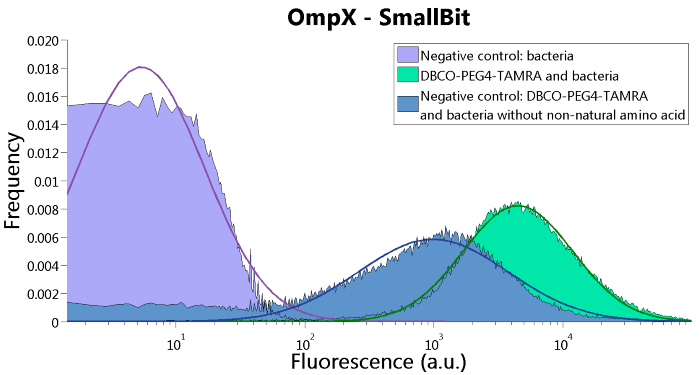
| 06:47, 18 September 2015 | TU Eindhoven FACS OmpX SmBit.png (file) |  |
50 KB | FACS results of the OmpX - SmallBit construct | 1 |
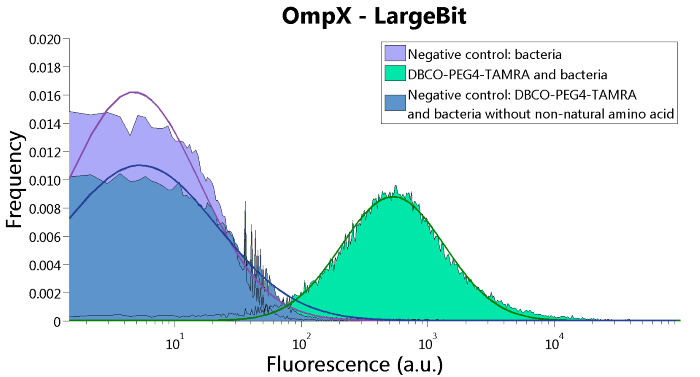
| 06:46, 18 September 2015 | TU Eindhoven FACS OmpX LgBit.png (file) |  |
46 KB | FACS results of the OmpX - LargeBit construct. | 1 |
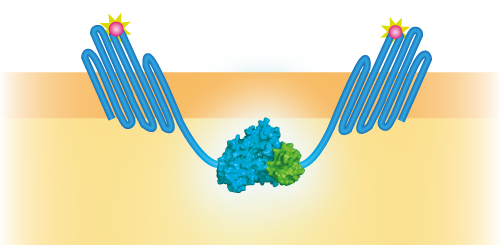
| 06:45, 18 September 2015 | TU Eindhoven OmpX LgBiT and OmpX SmBiT.png (file) |  |
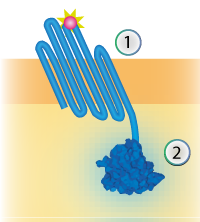
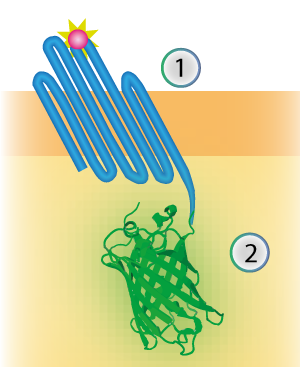
69 KB | Schematical overview of the NanoBit construct | 1 |
| 06:44, 18 September 2015 | TU Eindhoven Construct OmpX SmBiT.png (file) |  |
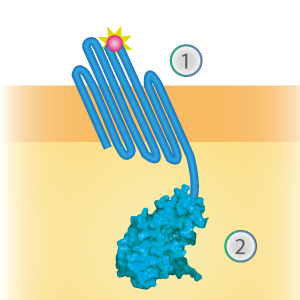
38 KB | Schematical overview of the OmpX (1) - SmallBit (2) construct. | 1 |
| 06:44, 18 September 2015 | TU Eindhoven Construct OmpX LgBiT.png (file) |  |
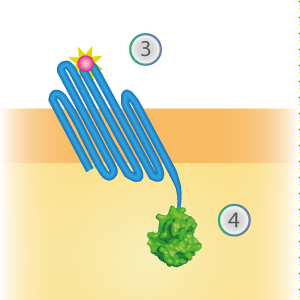
46 KB | Schematical overview of the OmpX (1) - LargeBit (2) construct. | 1 |
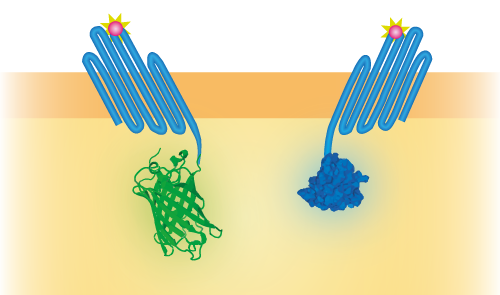
| 18:58, 16 September 2015 | TU Eindhoven Constructs OmpX NG and OmpX NL.png (file) |  |
84 KB | cropped | 2 |
| 18:57, 16 September 2015 | TU Eindhoven Construct OmpX NanoLuc.png (file) |  |
33 KB | cropped | 2 |
| 18:56, 16 September 2015 | TU Eindhoven Construct OmpX mNeonGreen.png (file) |  |
69 KB | cropped | 2 |
| 17:56, 16 September 2015 | TU Eindhoven DNA strand displacement System.png (file) |  |
42 KB | The membrane proteins can be brought in close proximity by clicking oligonucleotides on the loops and adding a long strand complementary to both oligonucleotides. It is expected that this results in a measurable signal. The longer strand is functionalized | 1 |
| 17:55, 16 September 2015 | TU Eindhoven DNA strand displacement.png (file) |  |
20 KB | Schematic overview of DNA strand displacement. DNA Strand displacement is initiated when the input binds to the toehold region of a partially hybridized DNA strand. After the initiation, branch migration takes place and the input fully hybridizes with its | 1 |
| 17:47, 16 September 2015 | TU Eindhoven Oligos verification.png (file) |  |
114 KB | To verify whether the click reaction has occured with DBCO-modified DNA, we incubate the cells with DBCO-functionalized complementary strands. If the DBCO-modified DNA clicks, the fluorescently labeled DBCO-functionalized complementary strands will anneal | 1 |
| 18:12, 15 September 2015 | TU Eindhoven RET Simplified Energy-level diagram.png (file) |  |
76 KB | Simplified energy-level diagram of RET. A) Normally, an excited electron falls back to its ground state under the emission of light (a radiative transition). B) In the case of Resonance Electron Transfer, an excited electron in the donor falls back to its | 1 |
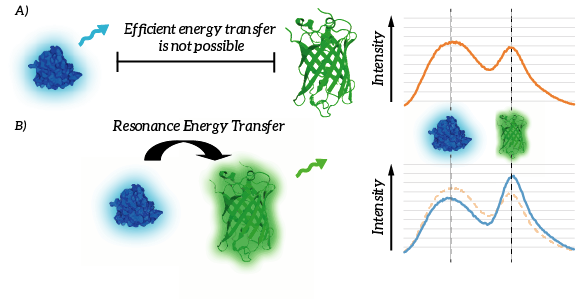
| 18:01, 15 September 2015 | TU Eindhoven Efficient energy transfer.png (file) | 89 KB | A) Efficient energy transfer is not possible since the donor and fluorophore are to remote. B) Efficient energy transfer is possible due to the proximity of the donor and acceptor. As a result, light intensity of the donor decreases whereas light intensit | 1 | |
| 17:57, 15 September 2015 | TU Eindhoven Resonance Energy Transfer and Bioluminiscence.png (file) | 260 KB | Resonance energy transfer (A) and split luciferases (B) both translate close proximity into a measurable signal in the form of light. | 1 | |
| 10:09, 15 September 2015 | TU Eindhoven OmpX CPX.png (file) |  |
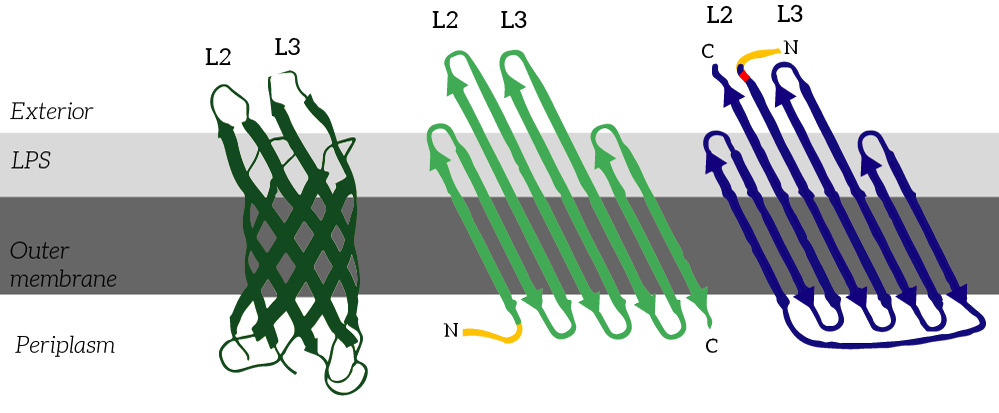
117 KB | CPX (right) is a membrane protein derived from OmpX (left) through circular permutation. OmpX and CPX feature signal sequences (yellow) which ensure that the membrane protein is localized to E.coli’s outer membrane. These signal sequences are cleaved fr | 1 |
| 10:04, 15 September 2015 | TU Eindhoven Tyrosine and Non-natural amino acid pAzF.png (file) |  |
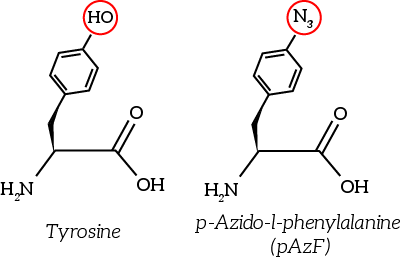
11 KB | The non-natural azide-functionalized amino acid closely resembles tyrosine. | 1 |
| 10:02, 15 September 2015 | TU Eindhoven Click Chemistry CPX.png (file) |  |
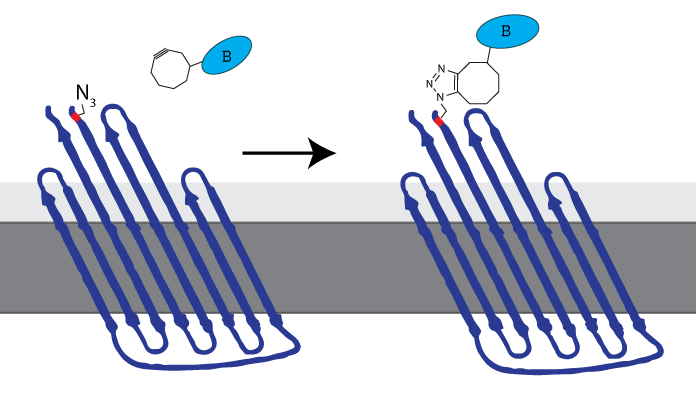
32 KB | The azide-functionalized amino acid enables clicking any DBCO-functionalized molecule to be attached to the cell membrane through SPAAC-click chemistry. iGEM TU Eindhoven 2014 called this azide-functionalized CPX COMPx. | 1 |
| 10:02, 15 September 2015 | TU Eindhoven OmpX Clicked aptamer and signaling domain.png (file) |  |
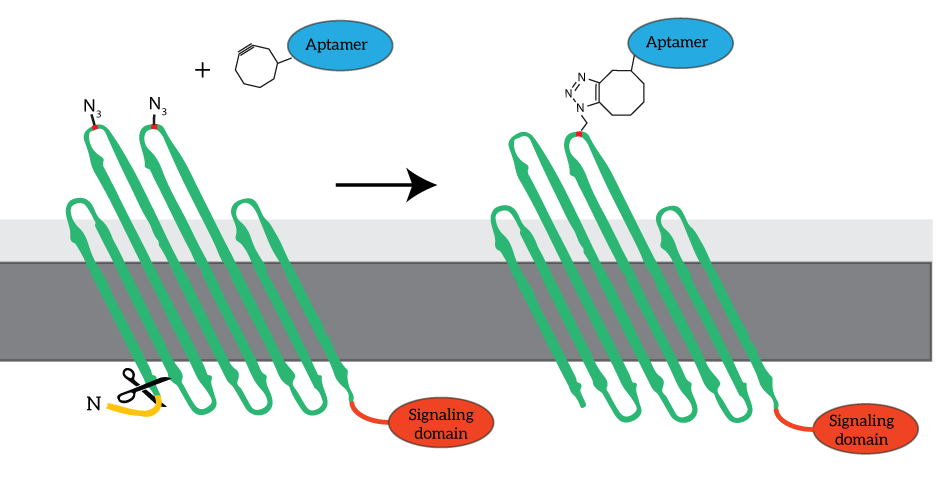
49 KB | CPX (right) is a membrane protein derived from OmpX (left) through circular permutation. OmpX and CPX feature signal sequences (yellow) which ensure that the membrane protein is localized to E.coli’s outer membrane. These signal sequences are cleaved fr | 1 |
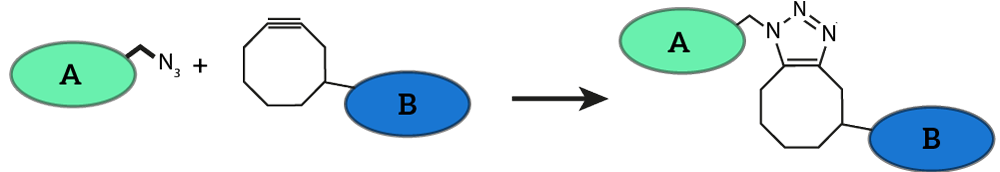
| 10:00, 15 September 2015 | TU Eindhoven Strain-Promoted Azide-Alkyne Cycloaddition.png (file) | 44 KB | Strain-promoted Azide-Alkyne Cycloaddition (SPAAC) is a well known click-chemistry reaction. The reaction features two molecules, one functionalized with an azide group (A) and one functionalized with a cyclooctyne group (B). SPAAC is very efficient and s | 1 | |
| 14:57, 11 September 2015 | TU Eindhoven mNeonGreen 3D-structure.png (file) |  |
28 KB | 3D-structure of mNeonGreen | 1 |
| 14:32, 11 September 2015 | TU Eindhoven OmpX NanoLuc SnapGene.png (file) |  |
110 KB | without background | 2 |
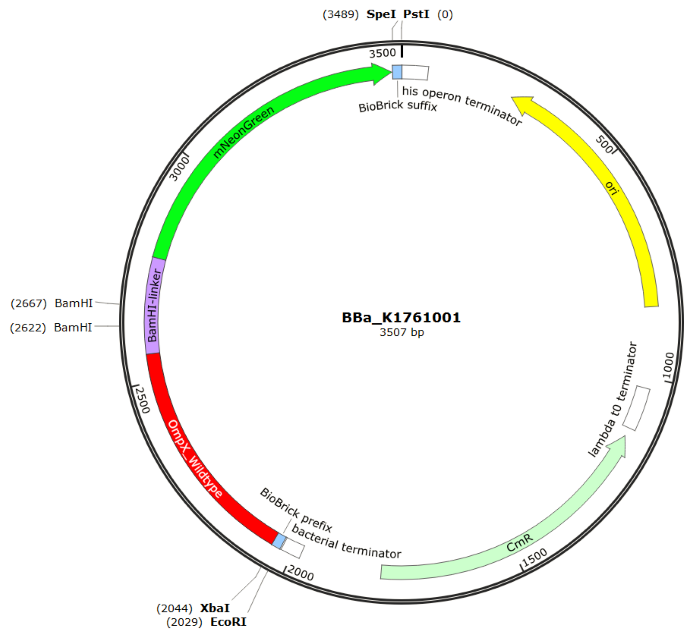
| 14:31, 11 September 2015 | TU Eindhoven OmpX mNeonGreen SnapGene.png (file) |  |
123 KB | without background | 2 |
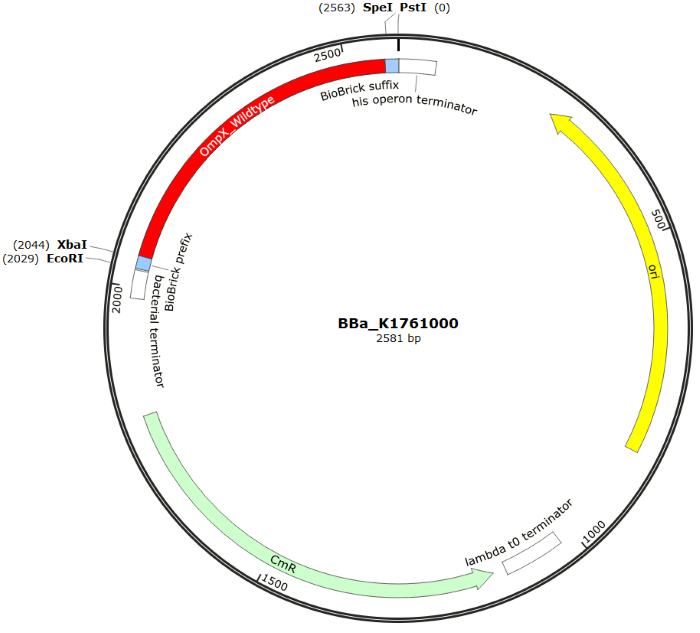
| 14:25, 11 September 2015 | TU Eindhoven OmpX SnapGene.png (file) |  |
114 KB | 2 | |
| 13:10, 11 September 2015 | TU Eindhoven Results Fluorescence mNeonGreen and NanoLuc.png (file) |  |
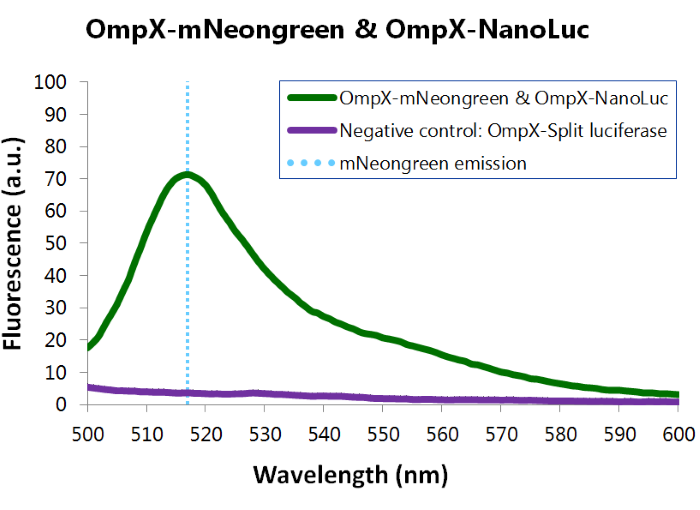
86 KB | Fluorescence assay results of OmpX – mNeonGreen and OmpX - NanoLuc. Excitation of mNeonGreen took place at a wavelenght of 480 nm with a laser. Emission was read out at 517 nm. From this experiment, it can be concluded that mNeonGreen is present and wor | 1 |
| 13:01, 11 September 2015 | TU Eindhoven Results Fluorescence mNeonGreen.png (file) |  |
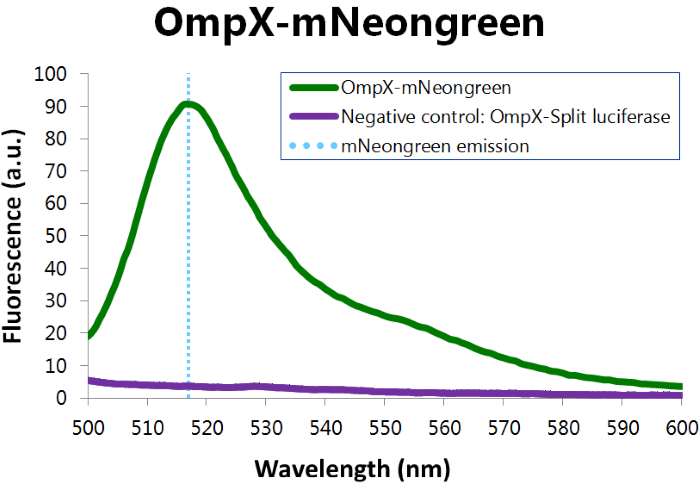
86 KB | Fluorescence assay results of OmpX – mNeonGreen. Excitation of mNeonGreen took place at a wavelenght of 480 nm with a laser. Emission was read out at 517 nm. From this experiment, it can be concluded that mNeonGreen is present and works. | 1 |
| 15:43, 9 September 2015 | TU Eindhoven FACS result OmpX NL.png (file) |  |
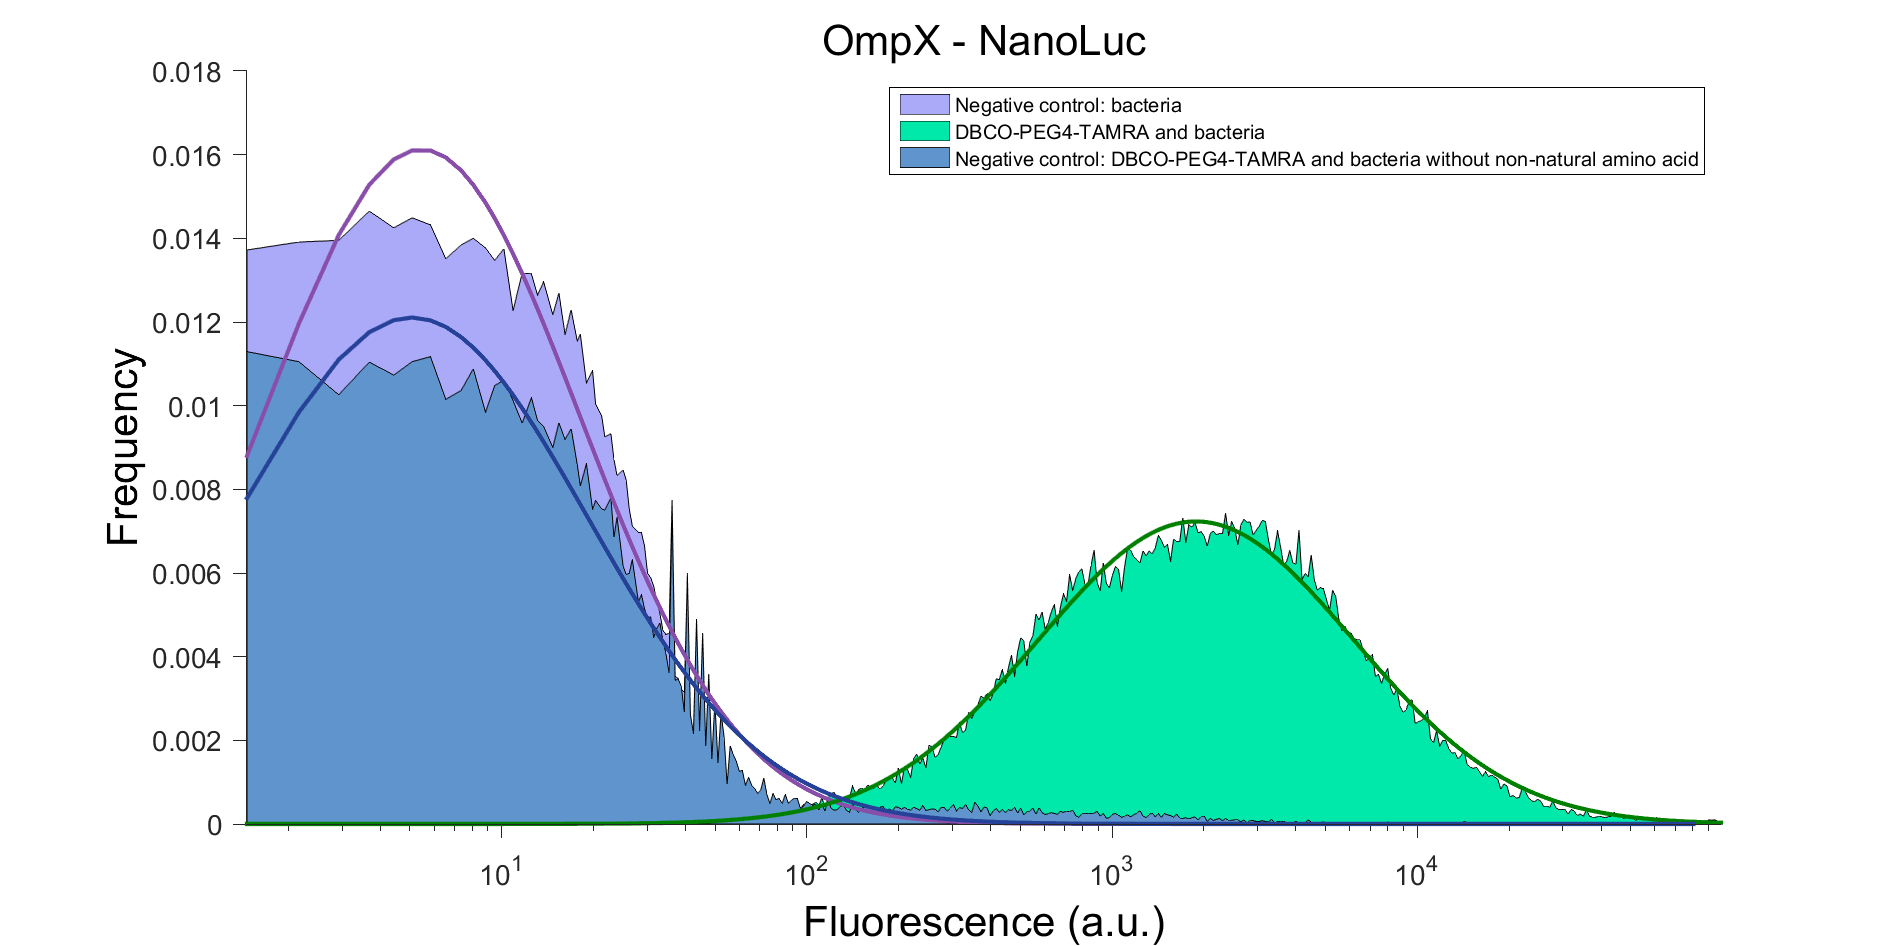
107 KB | FACS result of OmpX - NanoLuc, after clicking with DBCO-PEG4-TAMRA. DBCO-PEG4-TAMRA Confirmation To confirm whether OmpX is in the membrane and whether or not the non-natural amino acid is being incorporated into OmpX, DBCO-PEG4-TAMRA was used. TAMRA is | 1 |
| 14:34, 9 September 2015 | TU Eindhoven FACS result OmpX NG.png (file) |  |
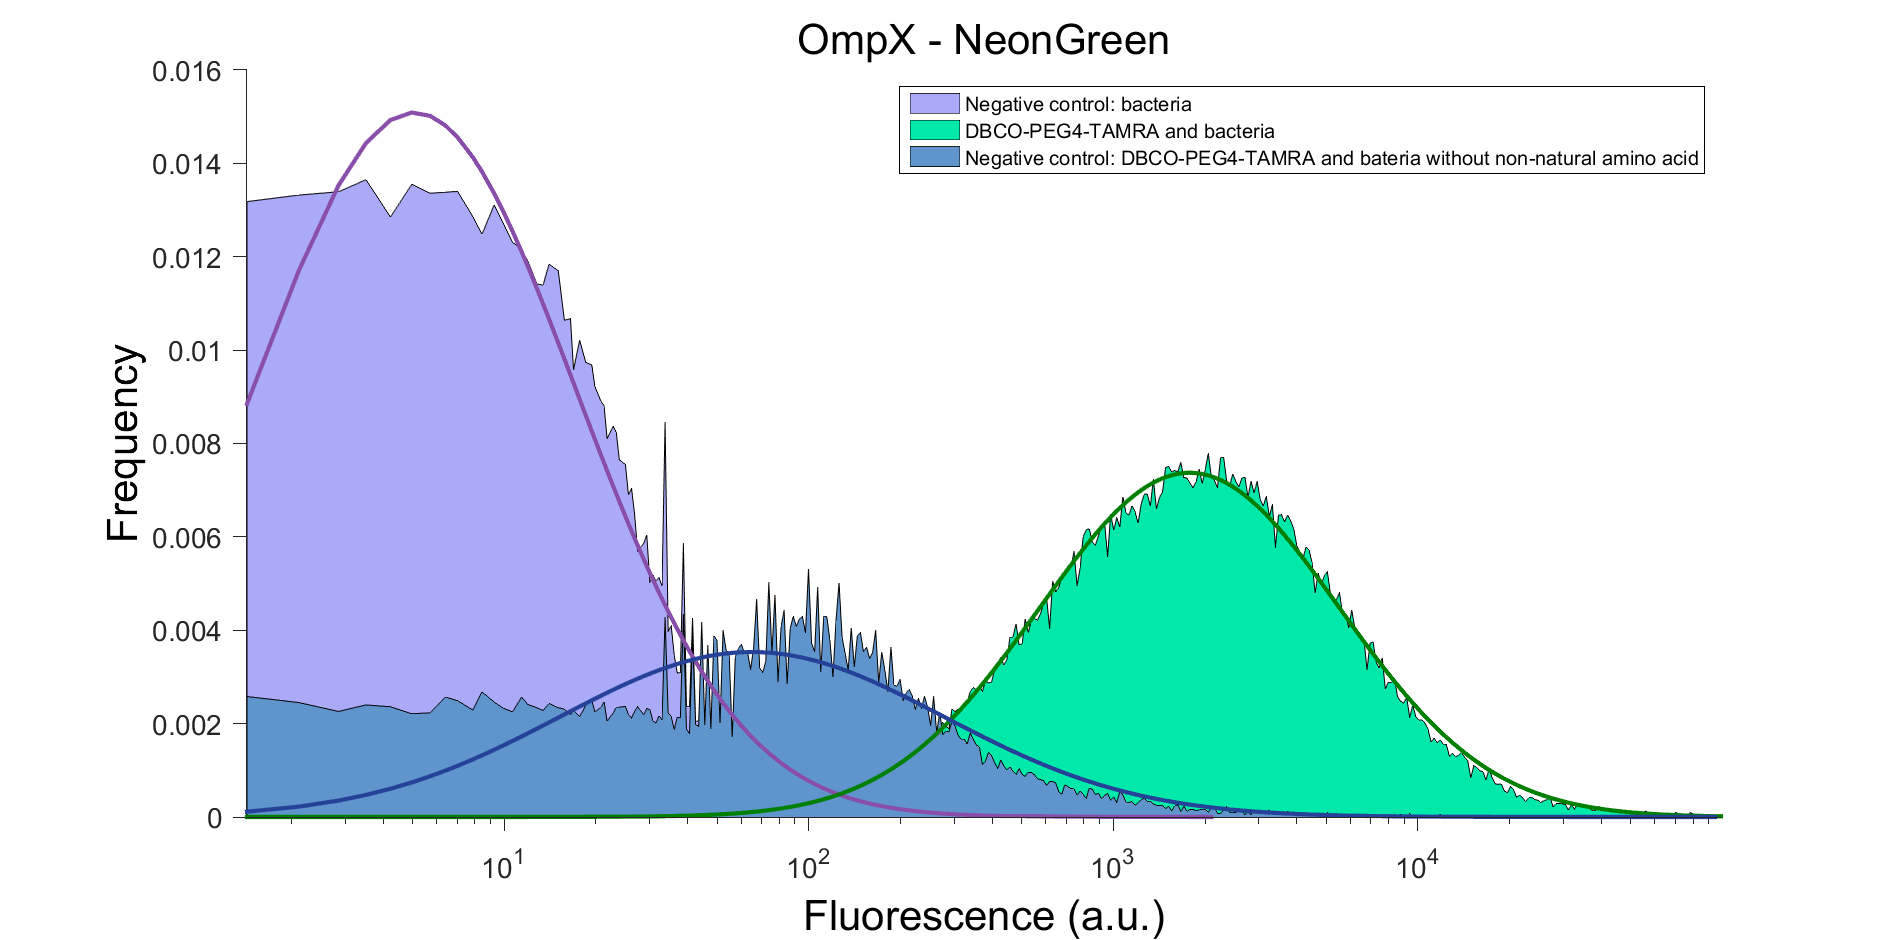
105 KB | FACS result of OmpX - mNeonGreen, after clicking with DBCO-PEG4-TAMRA. DBCO-PEG4-TAMRA Confirmation To confirm whether OmpX is in the membrane and whether or not the non-natural amino acid is being incorporated into OmpX, DBCO-PEG4-TAMRA was used. TAMRA | 1 |
| 14:10, 9 September 2015 | TU Eindhoven design ompxstructure.png (file) |  |
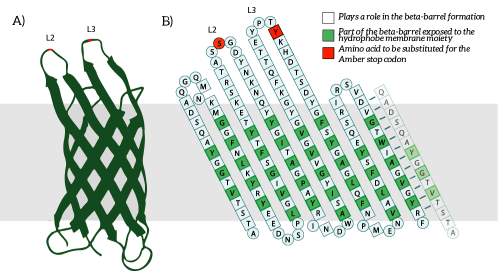
82 KB | A) The OmpX protein structure has been elucidated through NMR and X-ray crystallography, B) The square residues are important for the secondary structure of OmpX. To keep the structure intact, we introduce an amber stop codon in one of the protruding loop | 1 |