
File list
This special page shows all uploaded files.
| Date | Name | Thumbnail | Size | Description | Versions |
|---|---|---|---|---|---|
| 20:49, 15 September 2015 | Uppsala2015 J23101 P8.png (file) |  |
24 KB | The P8 measurement of MACS compared with the fluorometer results for the J23101 cultures | 1 |
| 20:48, 15 September 2015 | Uppsala2015 J23110 Fluorescence MACS.png (file) |  |
19 KB | The average of the four J23110+dT cultures (C1-4) compared to MACS-tests | 1 |
| 20:48, 15 September 2015 | Uppsala2015 J23101 Fluorescence MACS.png (file) |  |
27 KB | The average of the four J23101+dT cultures (C1-4) compared to MACS-tests | 1 |
| 20:46, 15 September 2015 | Uppsala2015 Average Fluorescence.png (file) |  |
16 KB | Average (AVG) values of J23101and J23110 cultures respectively, along with older cultures | 1 |
| 20:44, 15 September 2015 | Uppsala2015 J23110 Fluorescence.png (file) |  |
33 KB | Comparison of the fluorescence in J23110 cultures | 1 |
| 20:43, 15 September 2015 | Uppsala2015 J23101 Fluorescence.png (file) |  |
29 KB | Comparison of the fluorescence in J23101 cultures | 1 |
| 20:28, 15 September 2015 | Uppsala2015 Fluorometer.png (file) |  |
107 KB | A sliced model of the 3D-printed cuvette chamber | 1 |
| 20:26, 15 September 2015 | Uppsala2015 Filter Transmission.png (file) | 37 KB | The region shaded in blue represents the range over which this filter is transmissive. At wavelengths shorter than the cut-on wavelength, the filter blocks the light. Transmission is plotted including surface reflections. | 1 | |
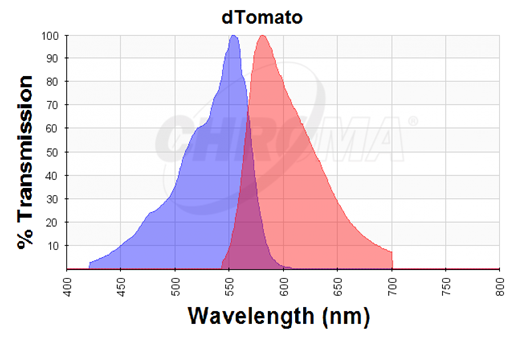
| 18:50, 15 September 2015 | Uppsala2015 dTomato Chromatogram.png (file) |  |
72 KB | Excitation (blue curve) and emission (red curve) spectra for the dTomato fluorescent protein (the graph is designed with the following tool: https://www.chroma.com/spectra-viewer) | 1 |
| 18:40, 15 September 2015 | DTomato Kromatogram.png (file) |  |
72 KB | Excitation (blue curve) and emission (red curve) spectra for the dTomato fluorescent protein (the graph is designed with the following tool: https://www.chroma.com/spectra-viewer) | 1 |