File list
This special page shows all uploaded files.
First page |
Previous page |
Next page |
Last page |
| Date | Name | Thumbnail | Size | Description | Versions |
|---|---|---|---|---|---|
| 20:45, 13 October 2022 | Aptamer-5HL9-Dock-Best.png (file) | 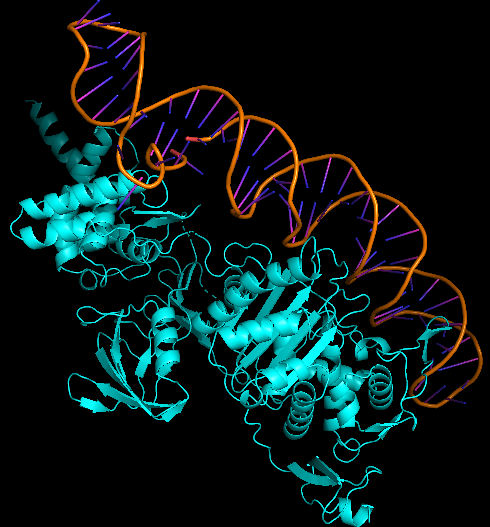 |
125 KB | E. coli PBP1b protein (5HL9) and aptamer docking - best configuration. | 1 |
| 20:44, 13 October 2022 | 5HL9.png (file) | 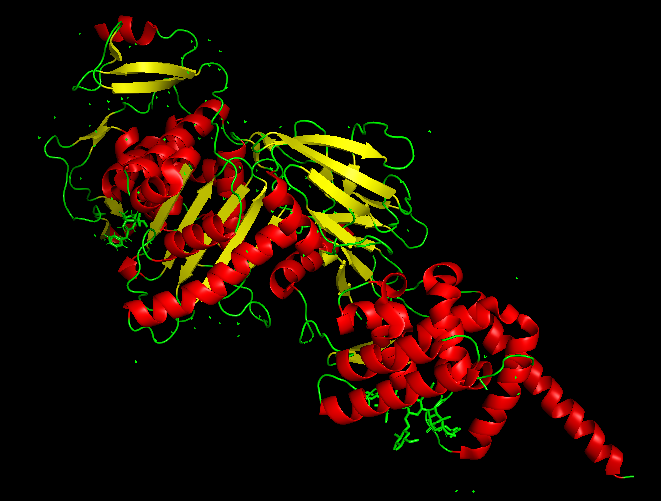 |
110 KB | Most likely surface protein of E. coli that aptamer binds to | 1 |
| 20:43, 13 October 2022 | E.coli simulation.gif (file) | 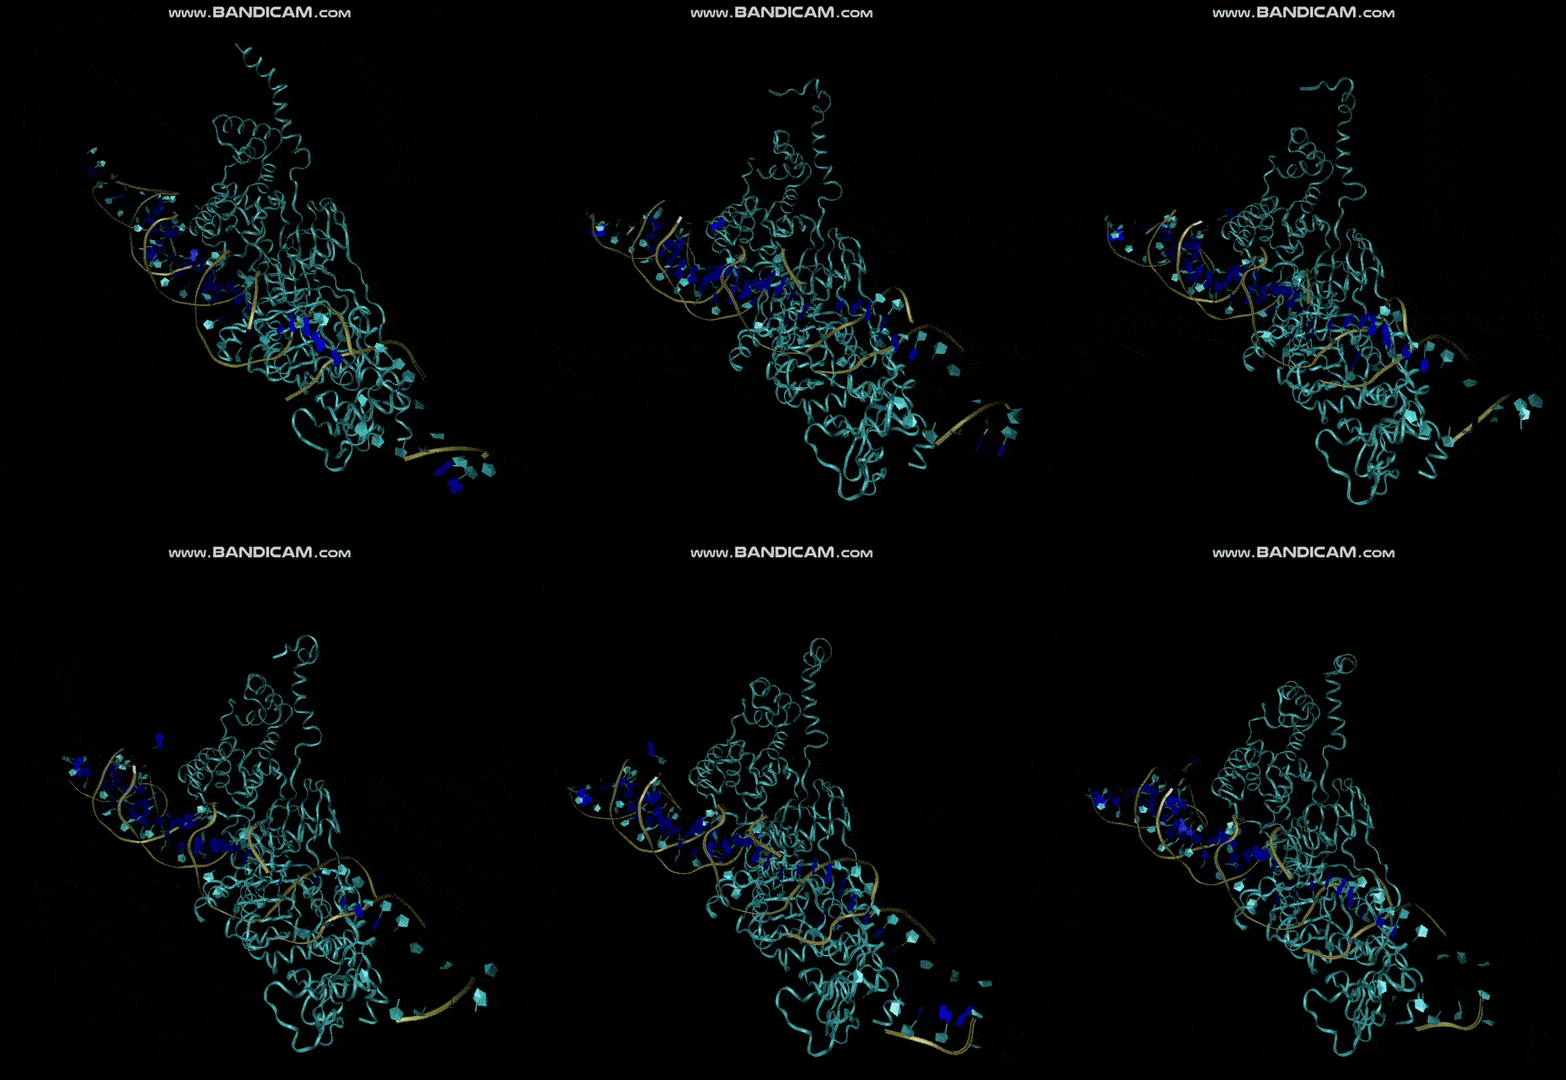 |
483 KB | MD Simulation of E. coli aptamer and 5HL9 binding | 1 |
| 19:12, 13 October 2022 | 7L17-Salmonella.png (file) | 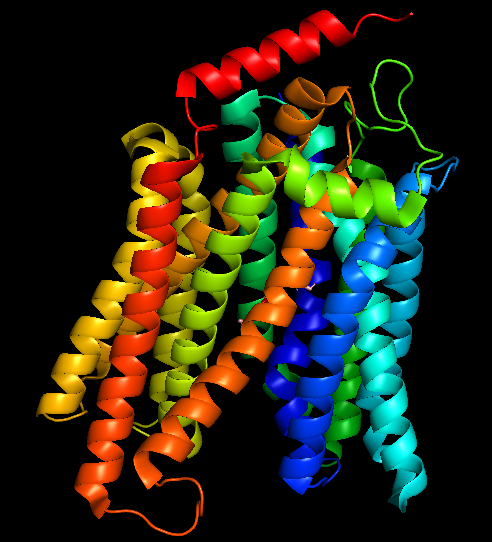 |
161 KB | 7L17-best docked S. typhimurium surface protein with aptamer | 1 |
| 19:11, 13 October 2022 | Docking-Salmonella Proteins.png (file) | 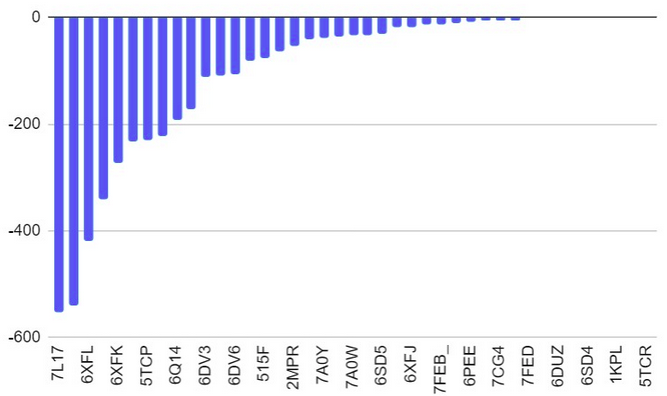 |
85 KB | Docking results of Salmonella surface proteins | 1 |
| 18:47, 13 October 2022 | Bind Sat Curve-Salmonella.png (file) | 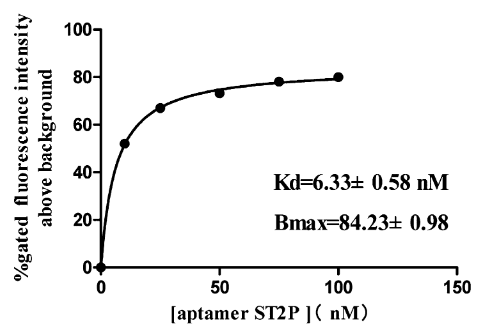 |
36 KB | Binding saturation curve of aptamer ST2P to the target S. typhimurium cells. | 1 |
| 18:46, 13 October 2022 | S Ty-Specificity.png (file) | 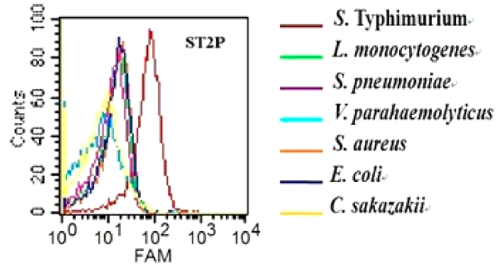 |
78 KB | Binding saturation curve of aptamer ST2P to the target S. typhimurium cells. | 1 |
| 18:45, 13 October 2022 | Salmonella-3D-Aptamer.png (file) | 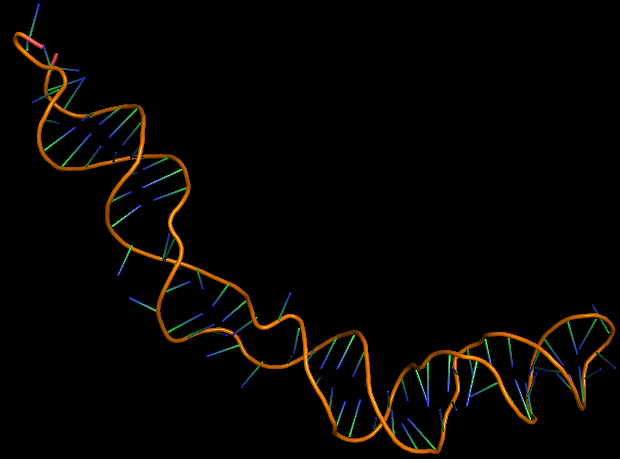 |
58 KB | 3D folded structure of S. typhimurium aptamer | 1 |
| 18:44, 13 October 2022 | Salmonella Aptamer-2D.png (file) | 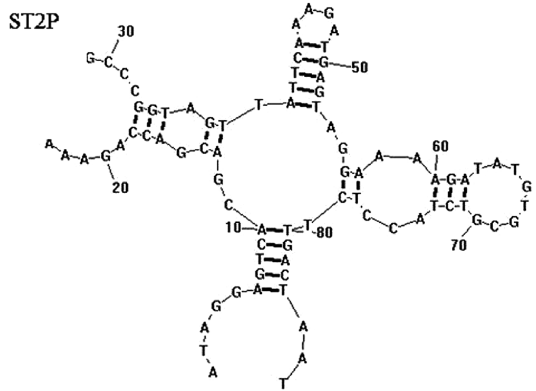 |
58 KB | 2D folded structure of S. typhimurium aptamer | 1 |
| 18:04, 13 October 2022 | ToxR Aptamer-3D.png (file) | 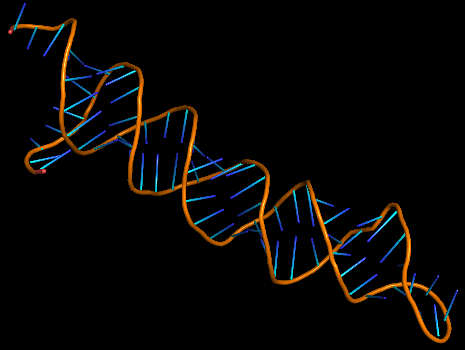 |
43 KB | Most probable 3D structure of ToxR aptamer | 1 |
| 16:14, 13 October 2022 | ToxR 2D-Aptamer.png (file) | 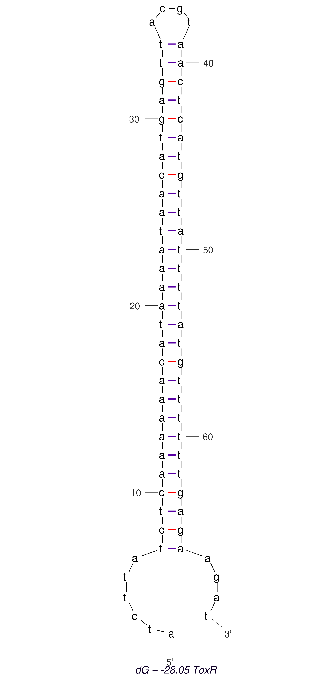 |
9 KB | 2D folded structure of the ToxR aptamer | 1 |
| 16:06, 13 October 2022 | ToxR- Aptamer-2D.png (file) | Error creating thumbnail: Invalid thumbnail parameters |
268 KB | 2D folded structure of ToxR aptamer | 3 |
| 15:47, 13 October 2022 | Docking-7NN6+7NMB.png (file) |  |
209 KB | 7NMB (cytoplasmic domain) and 7NN6 (periplasmic domain) of ToxR docking | 1 |
| 15:46, 13 October 2022 | Homology Modelling-ToxR.png (file) | 76 KB | 7NMB (cytoplasmic domain of ToxR) homology modelling | 1 | |
| 15:45, 13 October 2022 | Homology Search-ToxR.png (file) |  |
565 KB | ToxR homology search | 1 |
| 15:45, 13 October 2022 | 7nmb.jpeg (file) | 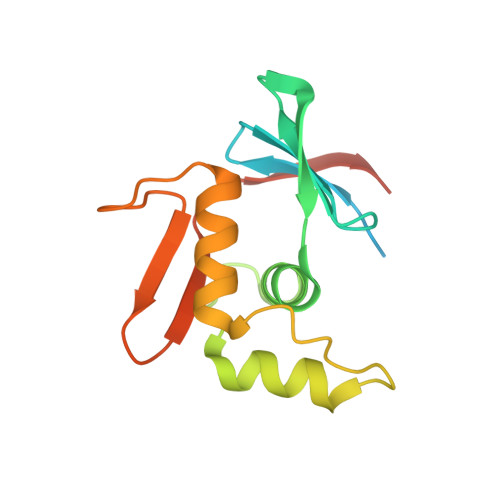 |
35 KB | Cytoplasmic domain of ToxR (PDB ID 7NMB) | 1 |
| 15:44, 13 October 2022 | 7nn6.jpeg (file) | 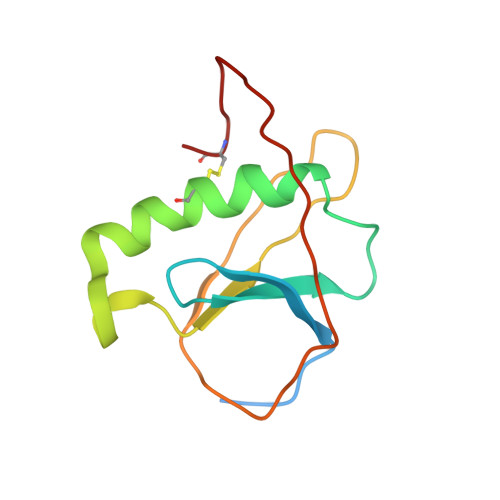 |
34 KB | Periplasmic domain of ToxR (7NN6) | 1 |
| 15:42, 13 October 2022 | 7NMB-Aptamer BestDockConf.png (file) | 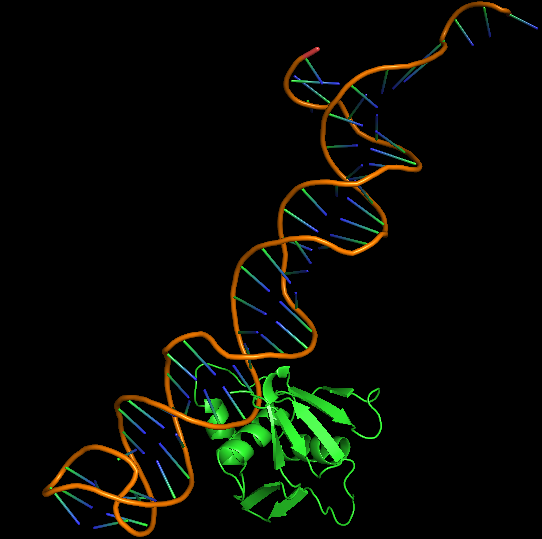 |
82 KB | Best docked configuration of 7NMB and Aptamer | 1 |
| 15:41, 13 October 2022 | Energy-Top10-Dock.png (file) | 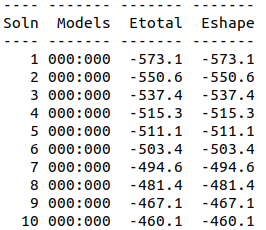 |
11 KB | Top 10 best docking - energy values for 7NMB and Aptamer | 1 |
| 13:57, 13 October 2022 | Penicillin-CV.png (file) |  |
87 KB | Cyclic Voltammetry curves of modified glassy carbon electrode @20mVs-1 in 5mM [Fe(CN)6]-3/-4 in 0.1 M PBS` for E.Coli 0.07 OD concentration | 1 |
| 13:57, 13 October 2022 | Penicillin-EIS.png (file) | 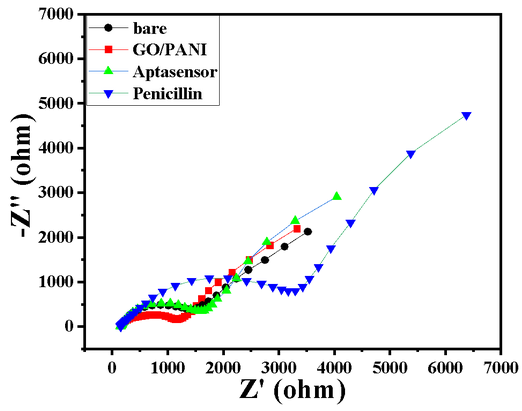 |
59 KB | Nyquist plot showing the change in the RCT responses in the bare GC, GO/PANI modified GC, Aptasenor, and Aptasensor with Penicillin | 1 |
| 13:56, 13 October 2022 | RMSD-Aptamer-Penicllin-Dock.png (file) | 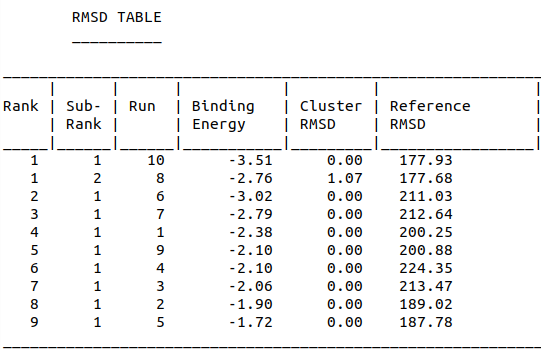 |
28 KB | RMSD Scores of Penicillin-Aptamer Docking | 1 |
| 13:52, 13 October 2022 | Energy-Aptamer-Penicillin-Dock.png (file) |  |
19 KB | Penicillin G aptamer docking cluster histogram showing binding energy | 1 |
| 13:51, 13 October 2022 | Penicillin-Aptamer-Dock-Conf.png (file) | 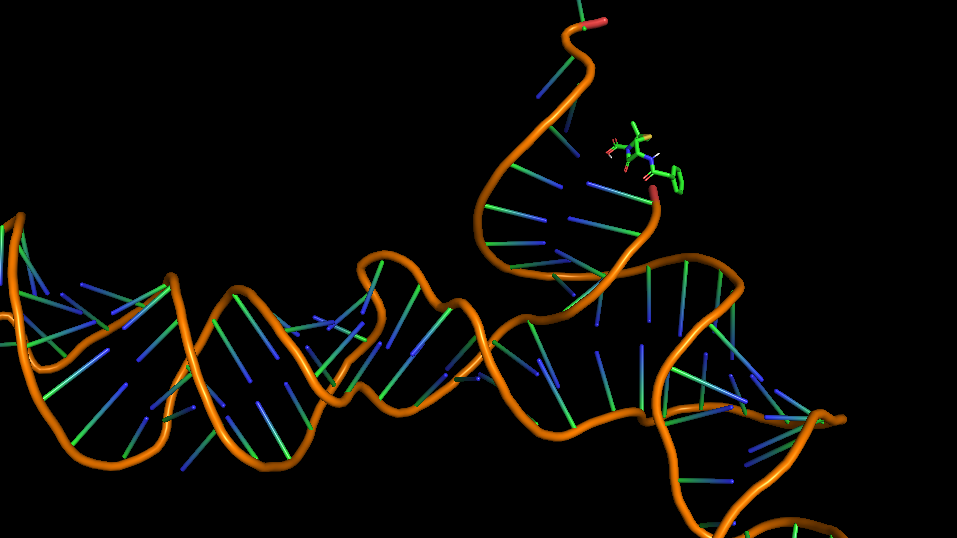 |
149 KB | Most probable docking configuration of Penicillin G and aptamer | 1 |
| 13:50, 13 October 2022 | Penicillin Aptamer-3D.png (file) | 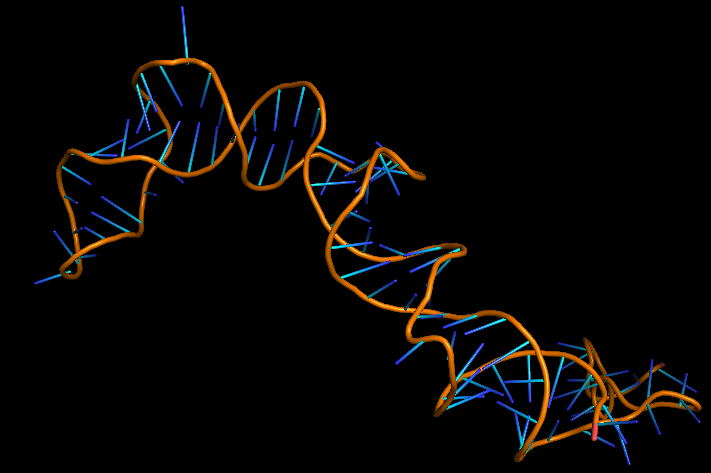 |
81 KB | 3D folded structure of Penicllin Aptamer | 1 |
| 13:50, 13 October 2022 | PG-3D.png (file) |  |
44 KB | Penicillin G 3D structure | 1 |
| 13:49, 13 October 2022 | PG-2D.png (file) | 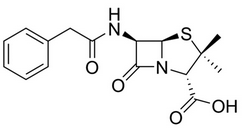 |
14 KB | Penicillin 2D structure | 1 |
| 13:49, 13 October 2022 | CaptureSELEX.jpg (file) | 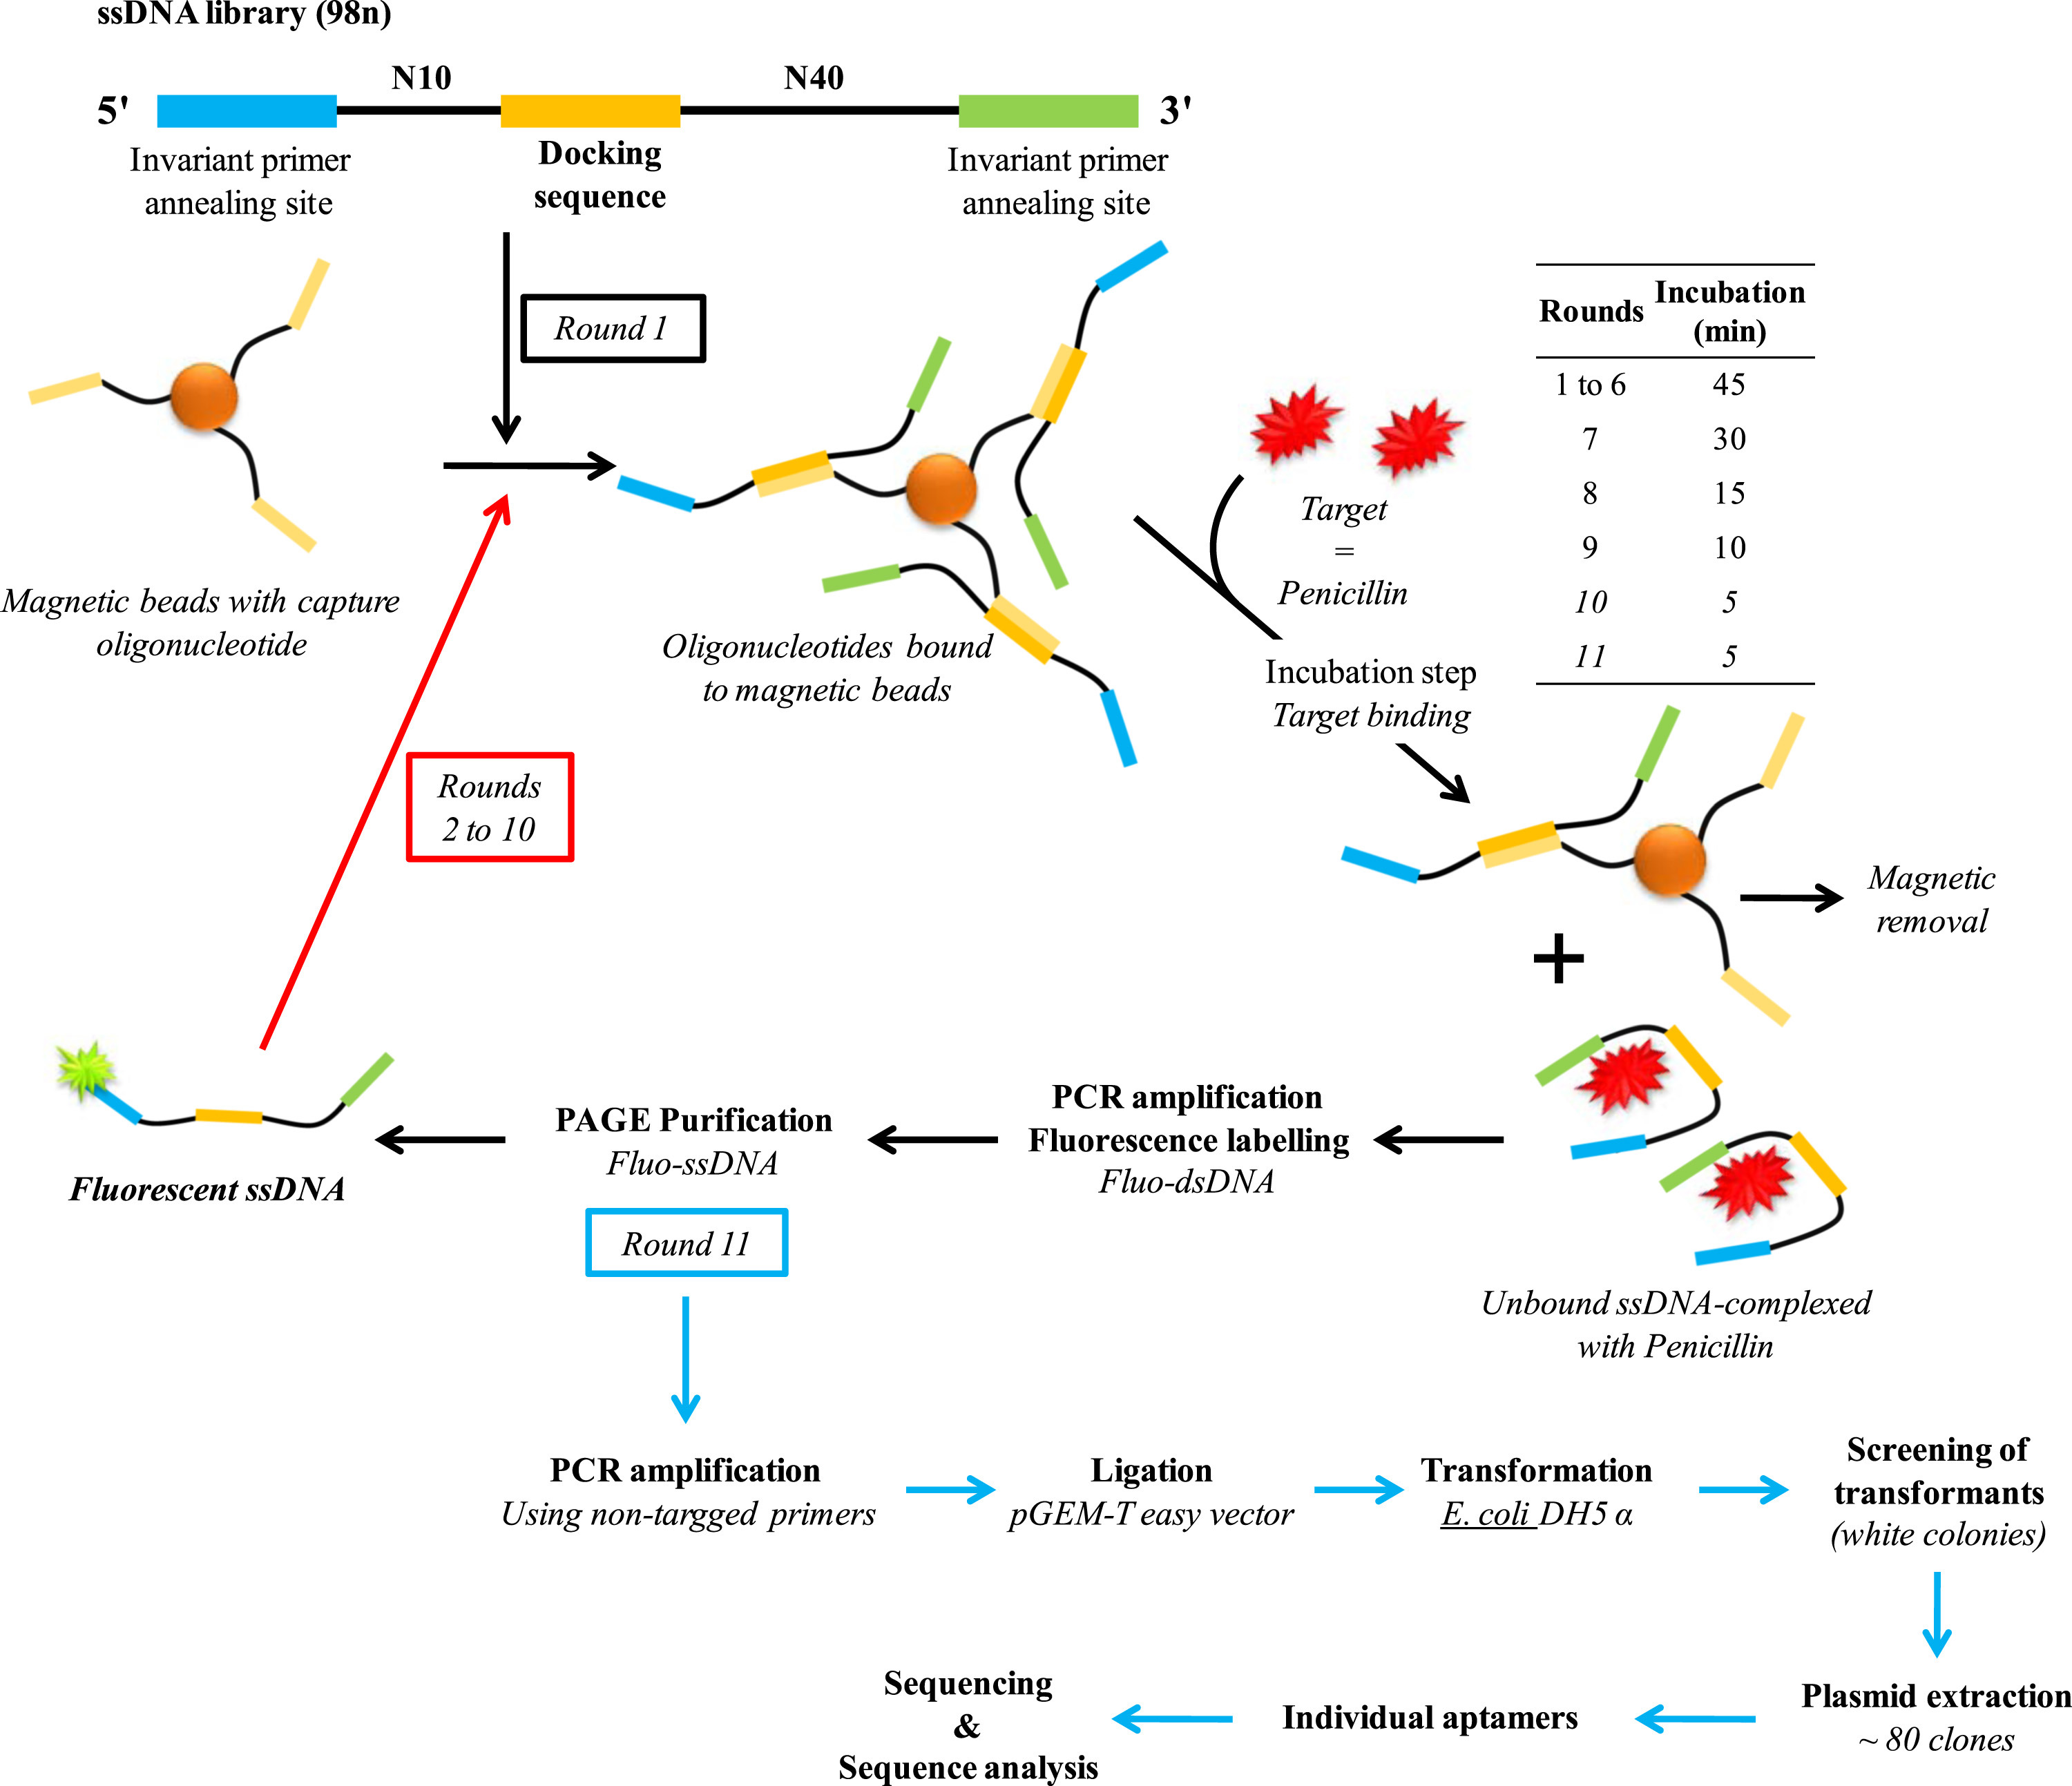 |
612 KB | SELEX steps to produce Penicillin G aptamer | 1 |
| 06:28, 13 October 2022 | PUC19.png (file) | 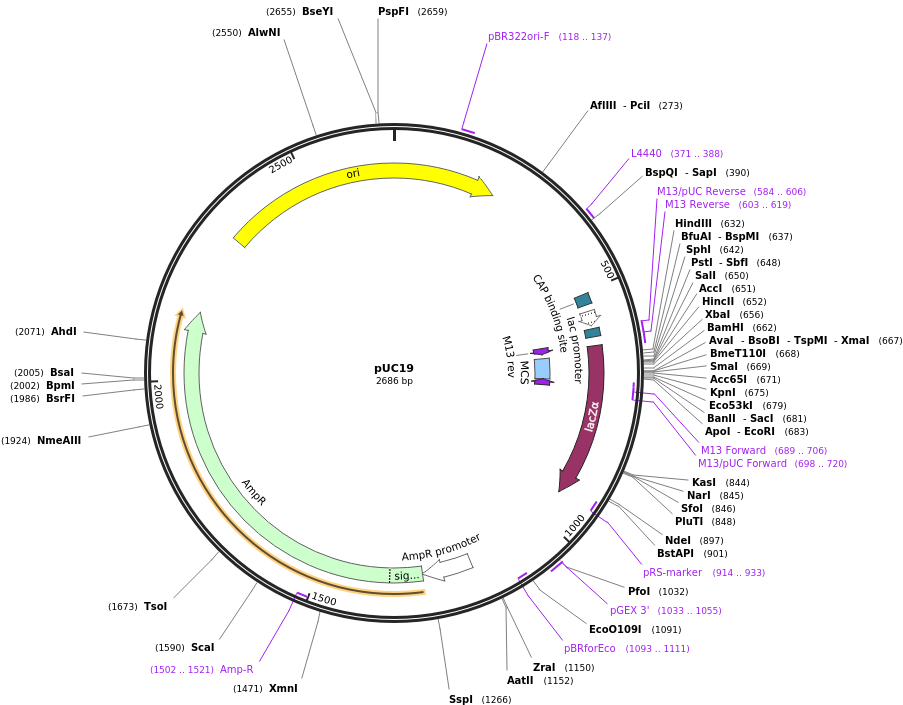 |
165 KB | pUC19 vector | 1 |
| 12:38, 12 October 2022 | CV-Sensitivity-Ecoli-0.7.png (file) | 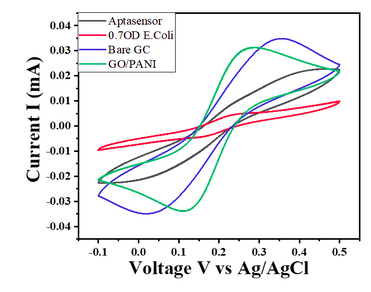 |
63 KB | Cyclic Voltammetry curves of modified glassy carbon electrode @20mVs-1 in 5mM [Fe(CN)6]-3/-4 in 0.1 M PBS for E.Coli 0.7 OD concentration | 1 |
| 12:37, 12 October 2022 | CV-Sensitivity-Ecoli-0.07.png (file) | 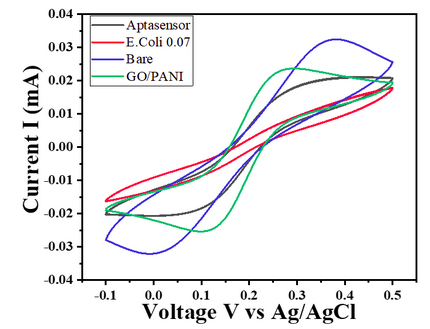 |
73 KB | Cyclic Voltammetry curves of modified glassy carbon electrode @20mVs-1 in 5mM [Fe(CN)6]-3/-4 in 0.1 M PBS` for E.Coli 0.07 OD concentration | 1 |
| 12:36, 12 October 2022 | Nyquist Plot-Sensitivity-Ecoli-0.7.png (file) | 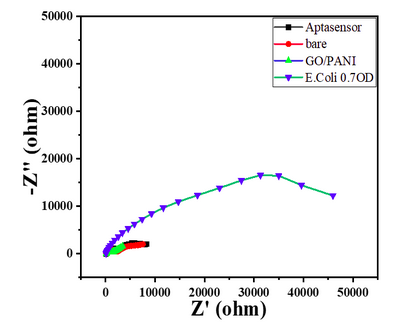 |
38 KB | Nyquist plot of 0.7 OD E. coli with its responses with bare GC, GO/PANI deposition, Aptasensor, and E. coli 0.7OD | 1 |
| 12:31, 12 October 2022 | Nyquist Plot-Sensitivity-Ecoli-0.07.png (file) | 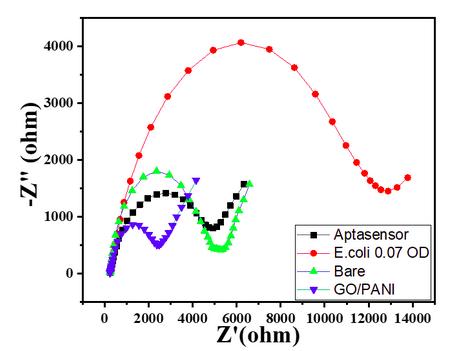 |
59 KB | Nyquist plot of 0.07 OD E.coli with its responses with bare GC, GO/PANI deposition, Aptasensor, and E.Coli 16 x 108 | 1 |
| 12:26, 12 October 2022 | Glassy ecoli.png (file) | 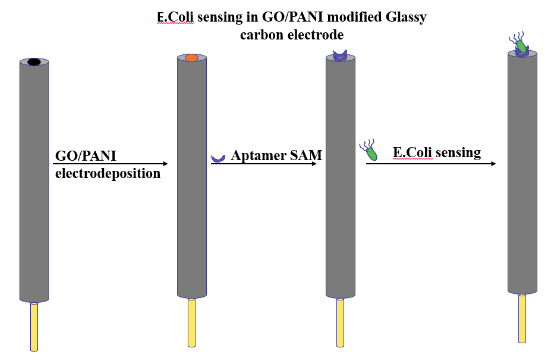 |
24 KB | Glassy carbon electrode modification for aptamer fixation on GO/PANI followed by E. coli sensing. | 1 |
| 12:25, 12 October 2022 | CVPlot Ecoli.png (file) | 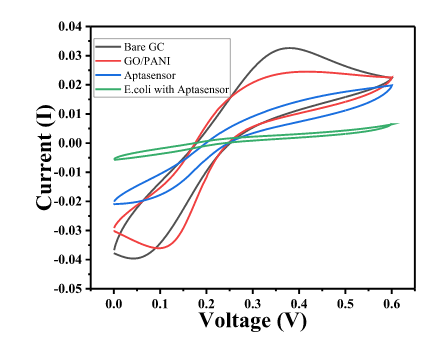 |
30 KB | Cyclic voltammetry plot obtained by aptamer fixation on GO/PANI follwed by E. coli sensing. | 1 |
| 12:23, 12 October 2022 | Nyquist plot E.coli.png (file) | 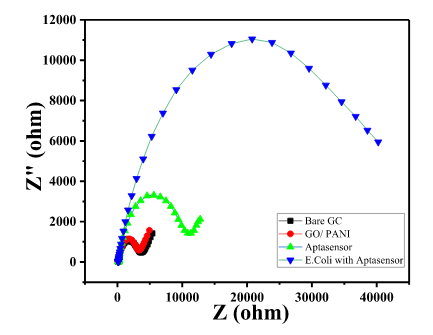 |
22 KB | Nyquist plot obtained by EIS of aptamer fixation on GO/PANI followed by E. coli sensing | 1 |
| 10:58, 12 October 2022 | Amanatitin-Aptamer Dock.png (file) | 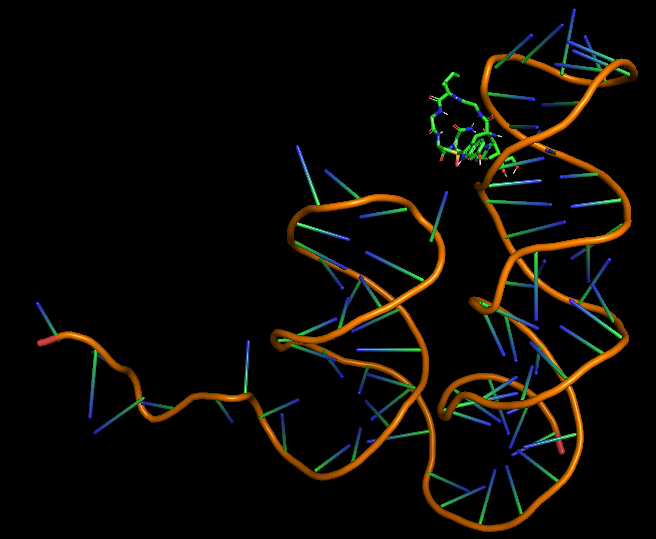 |
116 KB | Most probable (least energy and highest RMSD) docked configuration of alpha-amanitin and aptamer. | 1 |
| 10:57, 12 October 2022 | Amantinin Dock-RMSDTable.png (file) | 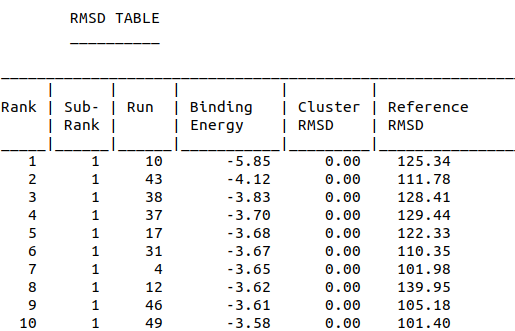 |
30 KB | RMSD scores of alpha-amanitin and aptamer docking | 1 |
| 10:56, 12 October 2022 | Amanitin Dock-ClusteringHistogram.png (file) | 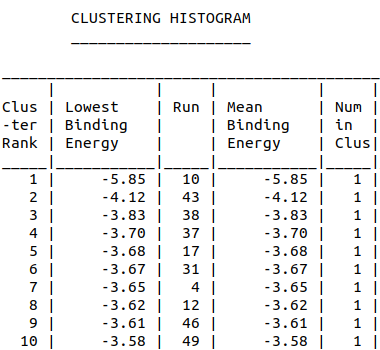 |
20 KB | Clustering Histogram of alpha-amanitin and aptamer docking | 1 |
| 11:17, 11 October 2022 | Amanitin aptamer3D.png (file) | 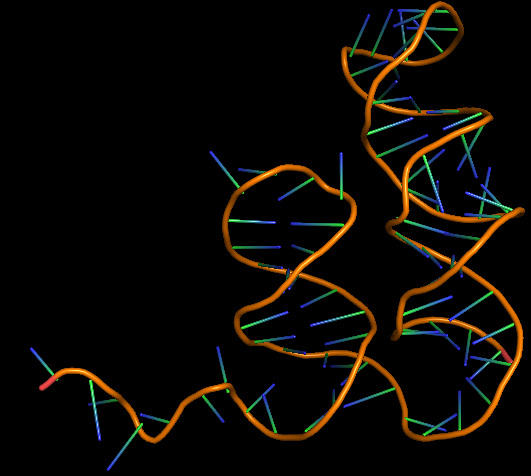 |
82 KB | 3D folded structure of alpha-Amanitin aptamer | 1 |
| 11:14, 11 October 2022 | Amanitin-3D.png (file) | 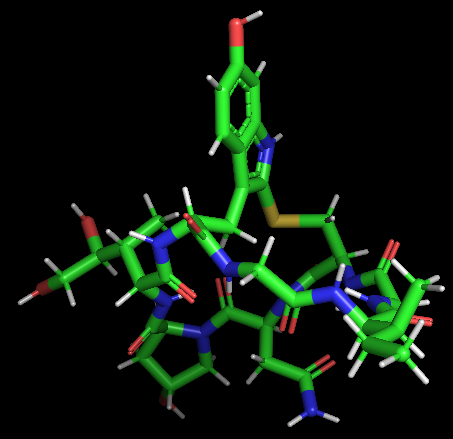 |
74 KB | 3D structure of alpha-Amanitin. | 1 |
| 11:11, 11 October 2022 | Alpha-Amanitine 500.png (file) | 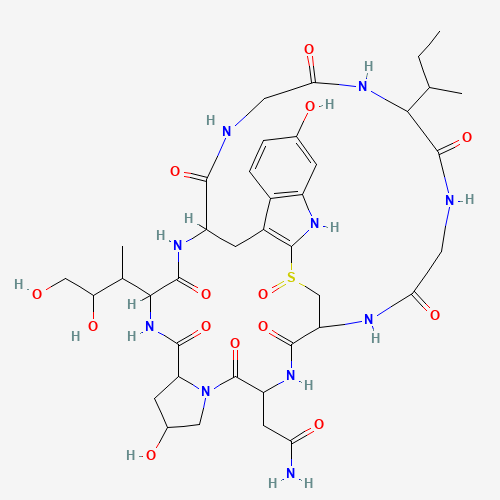 |
11 KB | Alpha-Amanitin 2D structure. | 1 |
| 12:05, 7 October 2022 | Ecoli-2D.png (file) | 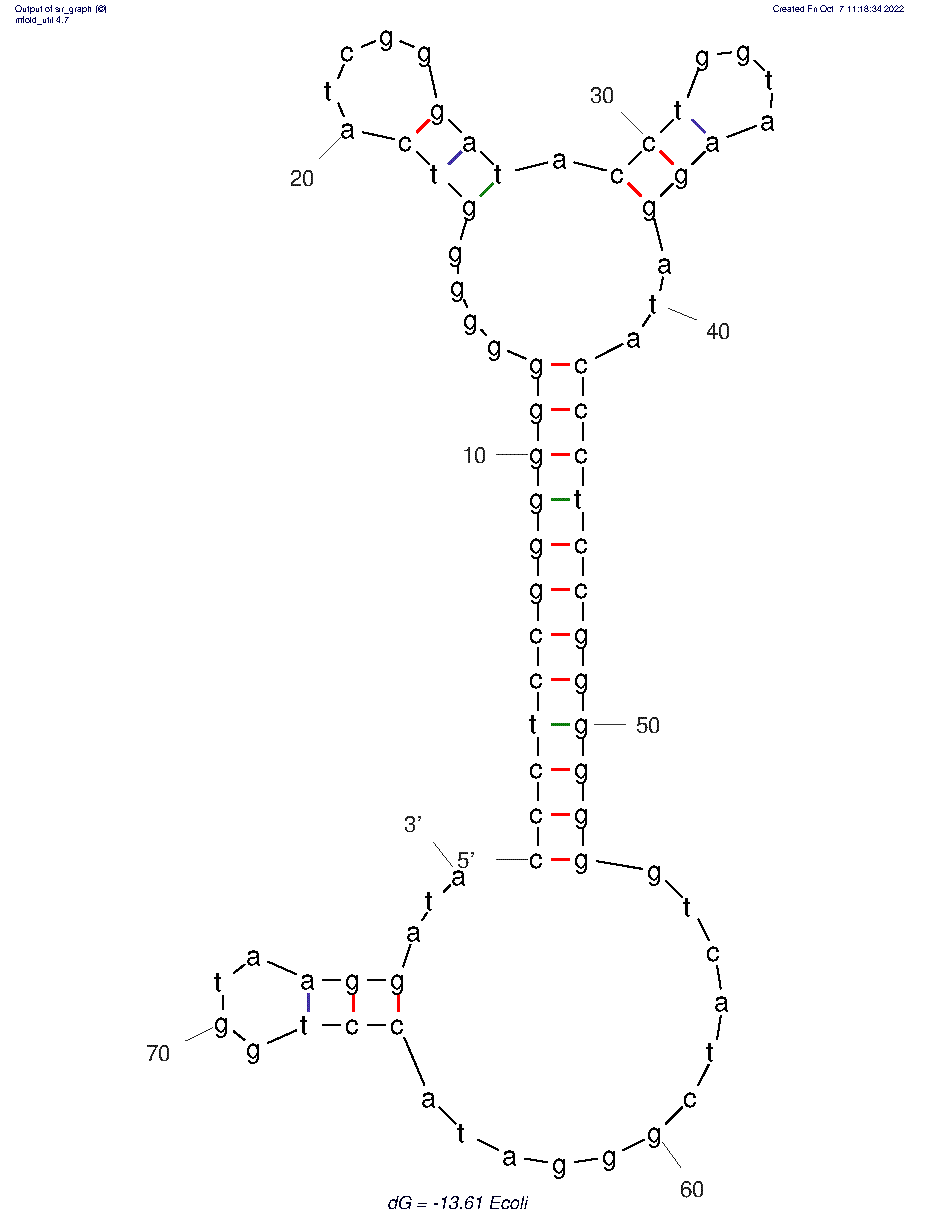 |
17 KB | Most probable 2D folded structure of E. coli aptamer. | 1 |
| 11:59, 7 October 2022 | Ecoli-3D structure.png (file) | 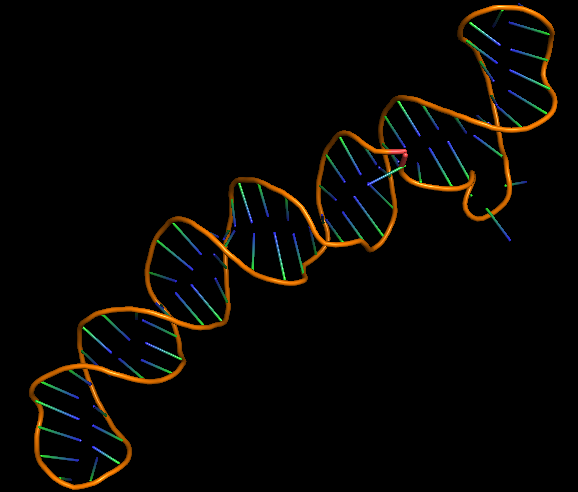 |
67 KB | 3D folded structure of E. coli aptamer. | 1 |
| 11:58, 7 October 2022 | P12-31 BindingAssay.png (file) | 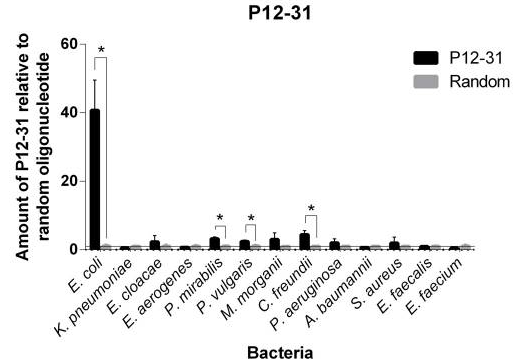 |
86 KB | P12-31 binding assay showing it specifically binds to E. coli. | 1 |
| 11:56, 7 October 2022 | SELEX.png (file) | 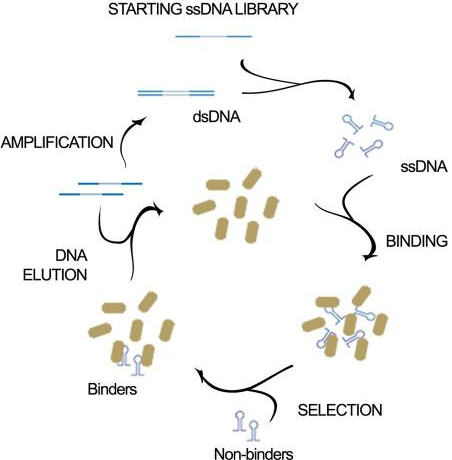 |
106 KB | Schematic of SELEX-used to generate aptamers against E. coli. | 1 |
| 18:33, 5 October 2022 | Rochester2021-Dock model 1.png (file) | 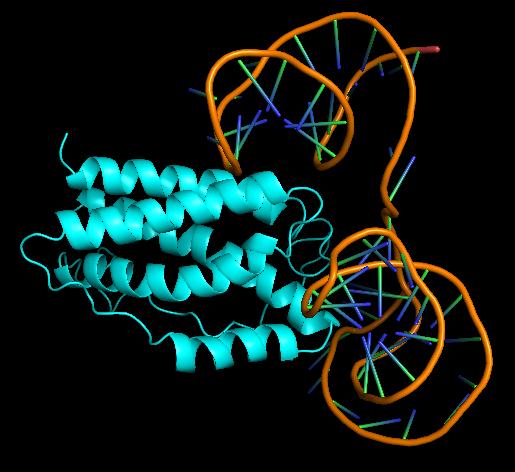 |
112 KB | Most favourable docked configuration of IL-5 aptamer and 1IL6. It has the lowest docking score and highest confidence score. | 1 |
| 18:31, 5 October 2022 | Aptamer-IL-6 DockResults.png (file) | 42 KB | Summary of top 10 docked models of IL-6 aptamer and 1IL6, in terms of docking and confidence scores. | 1 | |
| 18:29, 5 October 2022 | Rochester2021-IL-6 3D.png (file) | 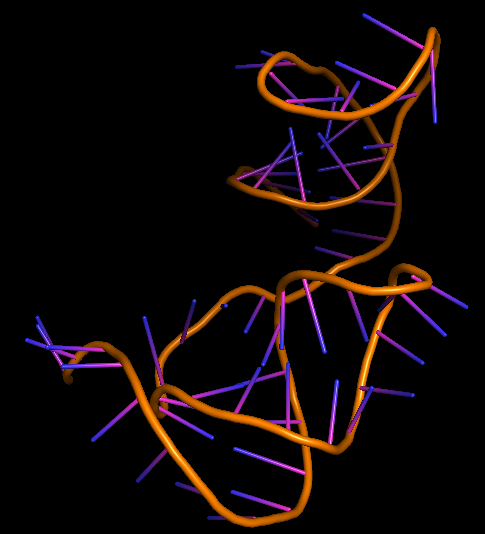 |
85 KB | Most favourable 3D structure of IL-6 aptamer. | 1 |
| 18:28, 5 October 2022 | Rochester-2021IL-6 2D.png (file) | 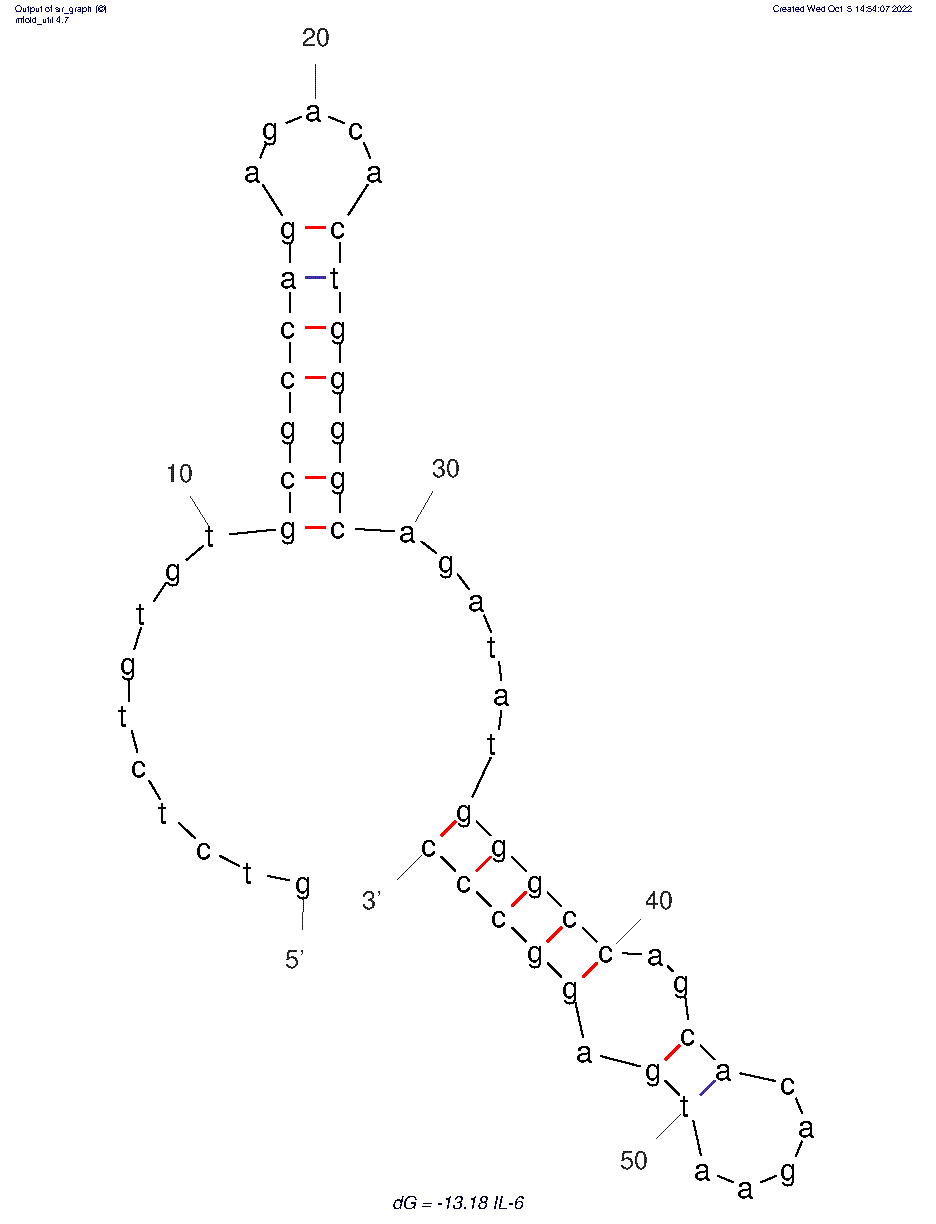 |
16 KB | 2D folded structure of IL-6 aptamer. | 1 |
First page |
Previous page |
Next page |
Last page |
