Loading menubar.....
File list
This special page shows all uploaded files.
File list
Items per page:
20
50
100
250
500
Search for media name:
Username:
Include old versions of images
Date
Name
Thumbnail
Size
Description
Versions
15:43, 21 October 2019
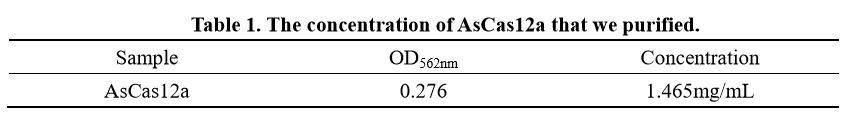
BBa K2965021-Table 1. AsCas12a concentration..png
(
file
)
26 KB
3
08:51, 21 October 2019
BBa K2965037-Figure 4. Quantitatively compared FnCas12a’s activity when using Fn-crRNA-HPV16-1 or 2..PNG
(
file
)
64 KB
1
08:47, 21 October 2019
BBa K2965037-Figure 3. The comparison between different Cas12a and different crRNA targeting different sequences..PNG
(
file
)
279 KB
1
08:45, 21 October 2019
BBa K2965037-Figure 2. Doing DNA reporter cleavage assay with gradient ion concentration..PNG
(
file
)
171 KB
1
08:41, 21 October 2019
BBa K2965037-Figure 1. 500bp from HPV16 L1 gene..PNG
(
file
)
311 KB
1
08:06, 21 October 2019
BBa K2965021-Figure 5. AsCas12a activity assay..png
(
file
)
23 KB
1
08:03, 21 October 2019
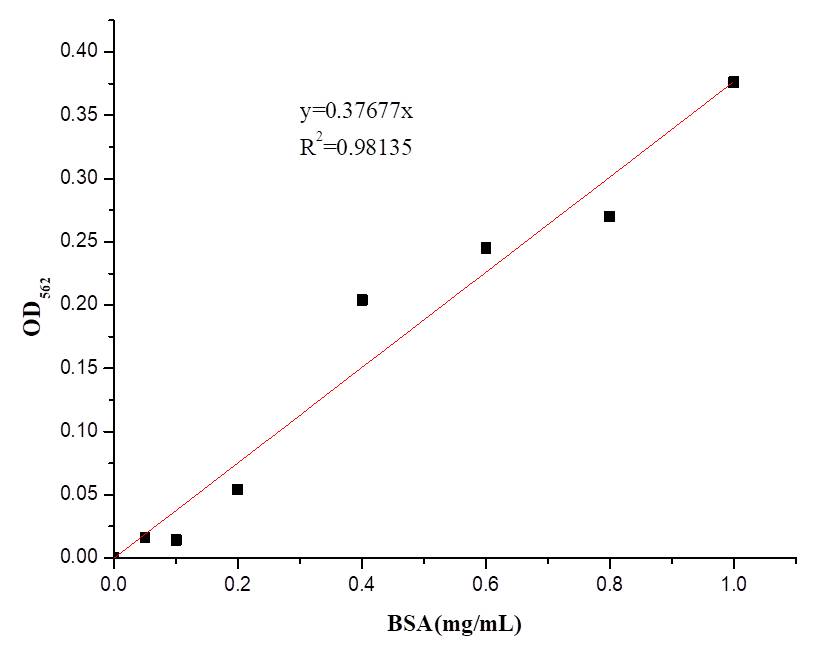
BBa K2965021-Figure 4. BSA standard curve..png
(
file
)
26 KB
1
07:56, 21 October 2019
BBa K2965021-Figure 3. AsCas12a WB..png
(
file
)
29 KB
1
07:53, 21 October 2019
BBa K2965021-Figure 2. AsCas12a SDS-PAGE..png
(
file
)
76 KB
1
07:45, 21 October 2019
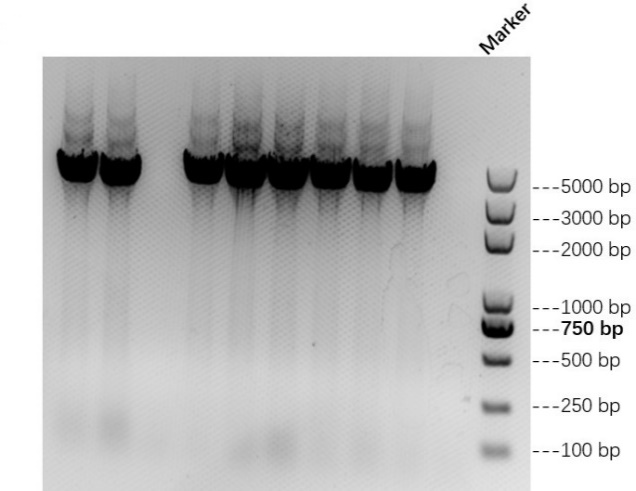
BBa K2965021-Figure 1. AsCas12a colony PCR..png
(
file
)
56 KB
1
06:44, 21 October 2019
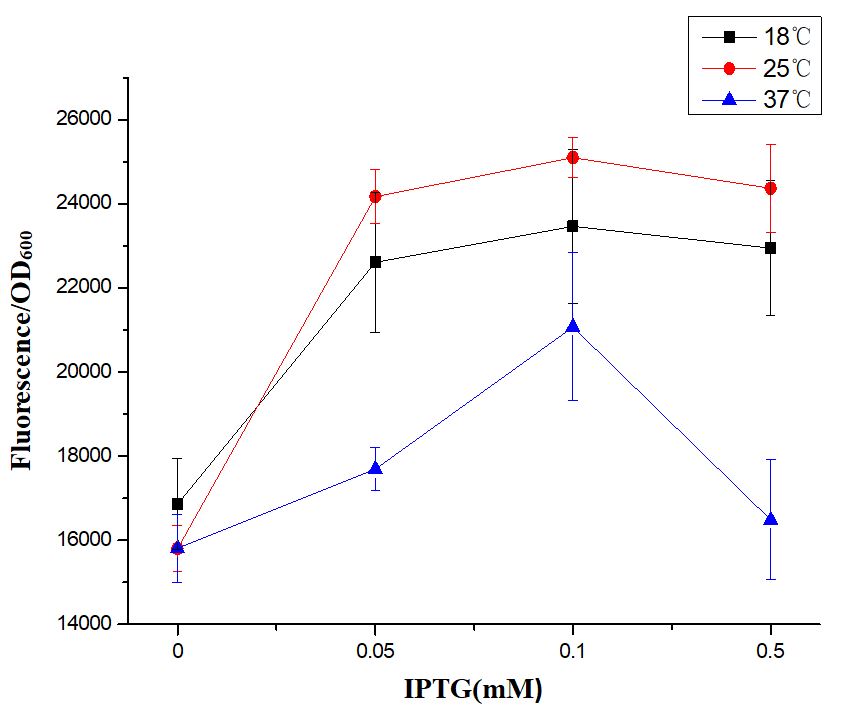
2019 ZJU-China Characterization Figure 2.The trend of green fluorescence intensity of E.coli BL21 (DE3) under the conditions of IPTG of 0 mM, 0.05 mM, 0.1 mM and 0.5 mM at 18℃, 25℃ and 37℃, respectively..png
(
file
)
55 KB
5
06:40, 21 October 2019
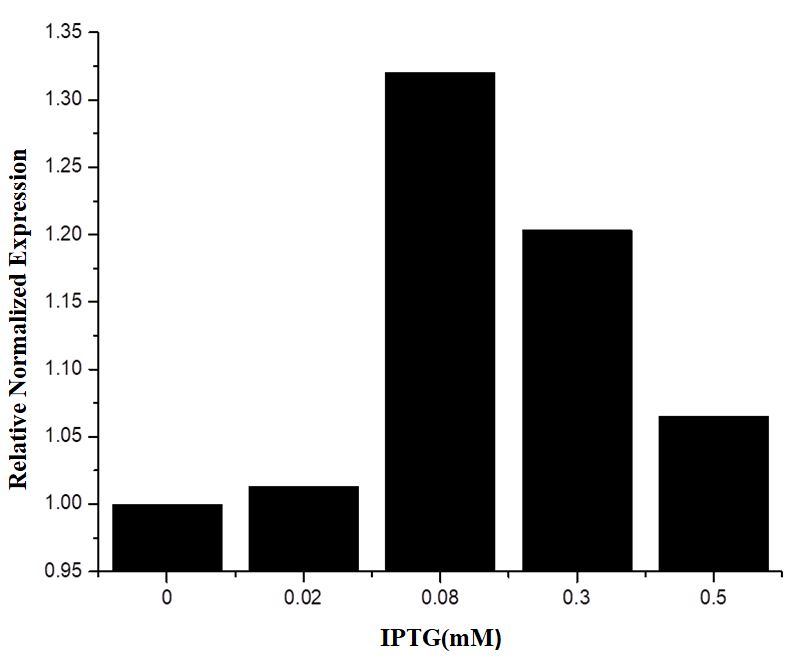
2019 ZJU-China Characterization Figure 3.The relative normalized expression level of EGFP of E.coli BL21 (DE3) under the conditions of IPTG concentration of 0 mM, 0.02mM, 0.08 mM, 0.3mM and 0.5 mM at 25℃..png
(
file
)
37 KB
4
17:24, 20 October 2019
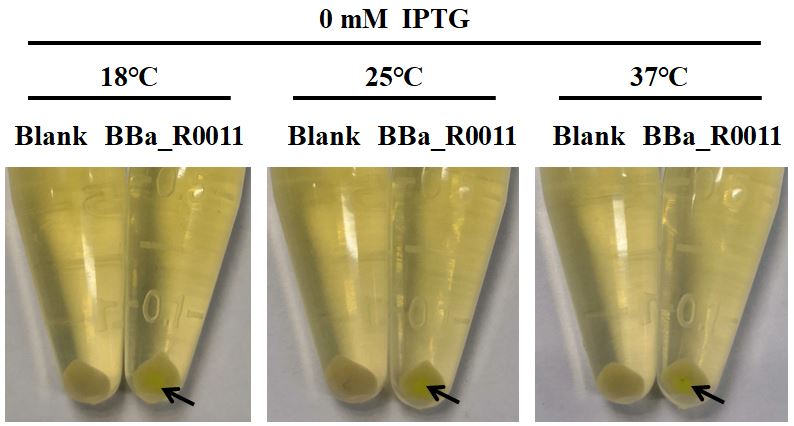
2019 ZJU-China Characterization Figure 1.The leakage of BBa R0011 in E.coli BL21(DE3) (with pSB1C3 as plasmid skeleton)..png
(
file
)
50 KB
The leakage of BBa_R0011 in E.coli BL21(DE3) (with pSB1C3 as plasmid skeleton).
1


_under_the_conditions_of_IPTG_of_0_mM,_0.05_mM,_0.1_mM_and_0.5_mM_at_18%E2%84%83,_25%E2%84%83_and_37%E2%84%83,_respectively..png)
_under_the_conditions_of_IPTG_concentration_of_0_mM,_0.02mM,_0.08_mM,_0.3mM_and_0.5_mM_at_25%E2%84%83..png)
_(with_pSB1C3_as_plasmid_skeleton)..png)