
File:Uppsala2015 dTomato Chromatogram.png
No higher resolution available.
Uppsala2015_dTomato_Chromatogram.png (522 × 338 pixels, file size: 72 KB, MIME type: image/png)
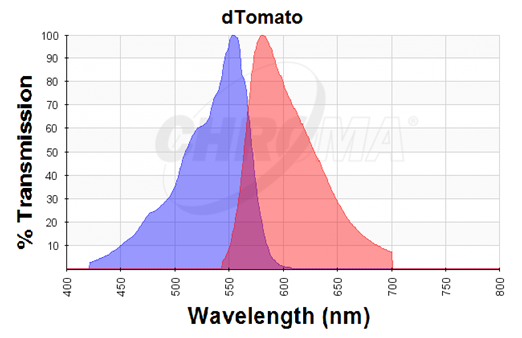
Excitation (blue curve) and emission (red curve) spectra for the dTomato fluorescent protein (the graph is designed with the following tool: https://www.chroma.com/spectra-viewer)
File history
Click on a date/time to view the file as it appeared at that time.
| Date/Time | Thumbnail | Dimensions | User | Comment | |
|---|---|---|---|---|---|
| current | 18:50, 15 September 2015 | | 522 × 338 (72 KB) | Diazel (Talk | contribs) | Excitation (blue curve) and emission (red curve) spectra for the dTomato fluorescent protein (the graph is designed with the following tool: https://www.chroma.com/spectra-viewer) |
- You cannot overwrite this file.
File usage
The following file is a duplicate of this file (more details):
The following 5 pages link to this file: