
File:TU Eindhoven results bioluminiscence neongreen and NanoLuc.png
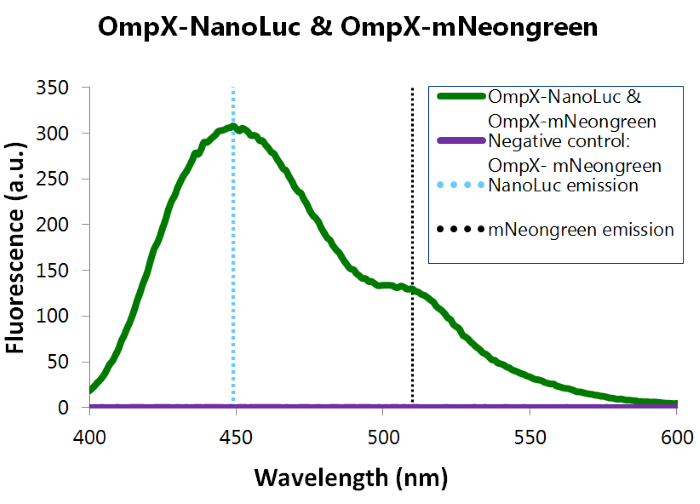
OmpX-NanoLuc's & OmpX-mNeonGreen's presence in the cells were tested by adding Nano-Glo substrate to the cells and measuring bioluminescence with the spectrophotometer. The figure below shows that OmpX-NanoLuc shows a peak characteristic for NanoLuc, indicating NanoLuc's presence within the cells. Moreover, the spectrogram shows a distinct shoulder near 517 nm, the emission wavelength of mNeongreen. Since no laser was used, excitation of mNeongreen can only be accomplished by NanoLuc so BRET occured. This signal is measured when no click reaction is performed on the complex, meaning that this can be seen as the background noise of the sensor of iGEM team TU Eindhoven 2015 .
File history
Click on a date/time to view the file as it appeared at that time.
| Date/Time | Thumbnail | Dimensions | User | Comment | |
|---|---|---|---|---|---|
| current | 19:31, 18 September 2015 | | 700 × 504 (86 KB) | S136969 (Talk | contribs) | OmpX-NanoLuc's & OmpX-mNeonGreen's presence in the cells were tested by adding Nano-Glo substrate to the cells and measuring bioluminescence with the spectrophotometer. The figure below shows that OmpX-NanoLuc shows a peak characteristic for NanoLuc, indi |
- You cannot overwrite this file.
File usage
The following file is a duplicate of this file (more details):
The following 2 pages link to this file: