
File:T--Goettingen--competitionassay microscopemitauswertungneu h.png
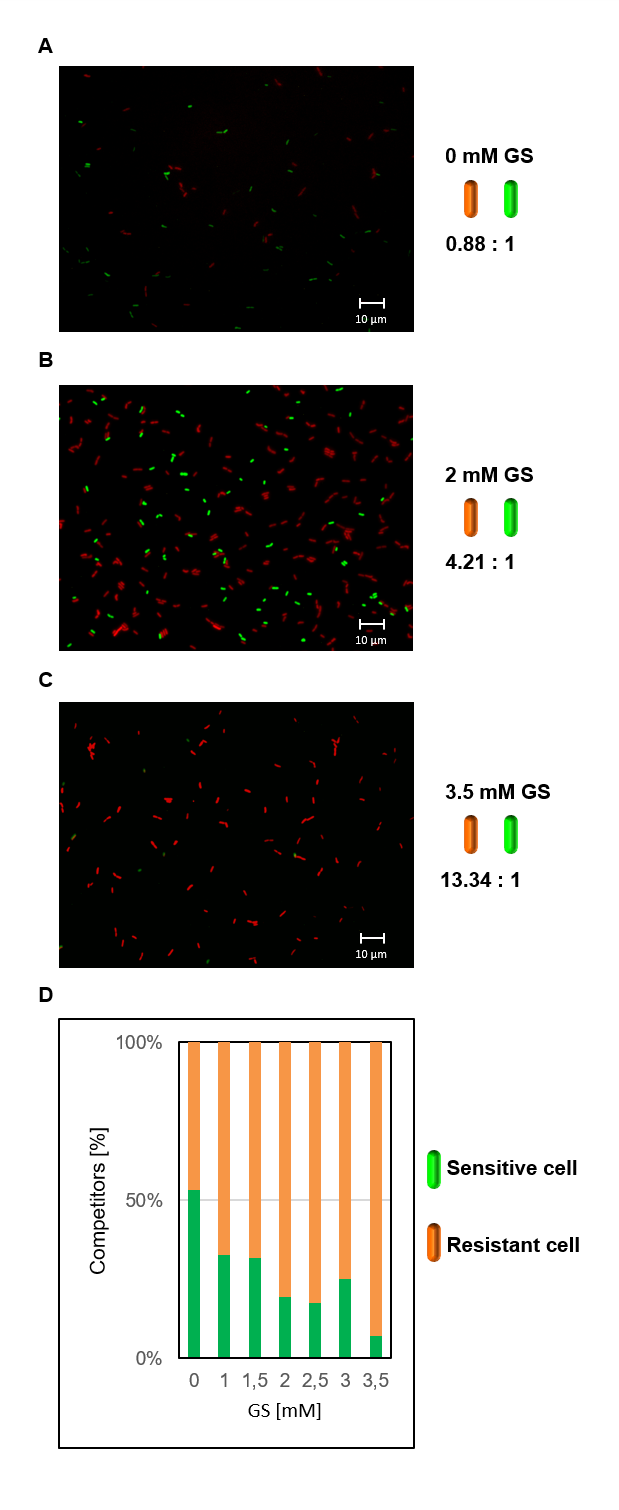
Green cells represent the wildtype strain (trpC2 amyE::(morange-lacZ aphA3)) and orange cells the double transporter mutant (trpC2 ΔgltT::spc ΔgltP::cat amyE::(morange-lacZ aphA3)). The ratio indicates the relative amount of orange cells in comparison to green cells. A: Merged channels orange and green from culture with 0 mM glyphosate after 4 h. There are nearly equal amounts of green and orange cells. B: Merged channels orange and green from culture with 2 mM glyphosate after 4 h. The number of orange cells is 4.21-fold higher. C: Merged channels orange and green from culture with 3.5 mM glyphosate after 4 h. Nearly no green cells are visible. D: Calculated ratio between the number of orange and green cells with increasing glyphosate concentrations.
File history
Click on a date/time to view the file as it appeared at that time.
| Date/Time | Thumbnail | Dimensions | User | Comment | |
|---|---|---|---|---|---|
| current | 12:44, 9 October 2018 | 619 × 1,510 (144 KB) | Robertw (Talk | contribs) | Green cells represent the wildtype strain (trpC2 amyE::(morange-lacZ aphA3)) and orange cells the double transporter mutant (trpC2 ΔgltT::spc ΔgltP::cat amyE::(morange-lacZ aphA3)). The ratio indicates the relative amount of orange cells in compariso... |
- You cannot overwrite this file.
File usage
The following 3 pages link to this file: