
File:P-Value by Sequence.png
Size of this preview: 800 × 385 pixels. Other resolution: 320 × 154 pixels.
Original file (901 × 434 pixels, file size: 40 KB, MIME type: image/png)
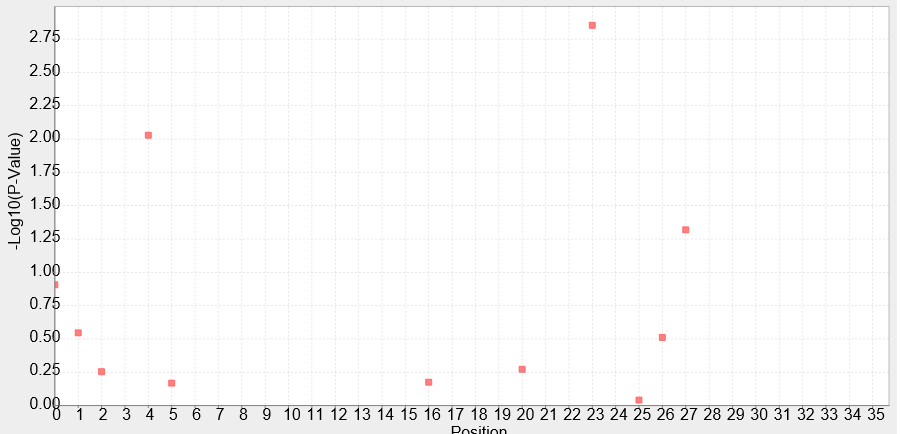
It shows the correlation degree between the each position of the site of the promoter and the strength of the promoter using a series of Anderson promoters to analyse. The abscissa of the figure represents the position of the site of the sequence of the promoter. The position start at "0", so the last of the number of the site is "34". The ordinate of the figure represents the P-Value of the each site. The higher the P-Value is the higher effect of the site is,and the lower strength of the promoter is at the same time. For example ,we will find out that the 24th site reduce the strength of the promoter greatly from the figure.
File history
Click on a date/time to view the file as it appeared at that time.
| Date/Time | Thumbnail | Dimensions | User | Comment | |
|---|---|---|---|---|---|
| current | 15:51, 10 October 2016 | | 901 × 434 (40 KB) | Cutter (Talk | contribs) | It shows the correlation degree between the each position of the site of the promoter and the strength of the promoter using a series of Anderson promoters to analyse. The abscissa of the figure represents the position of the site of the sequence of th... |
- You cannot overwrite this file.
File usage
The following page links to this file: