
File:HKUST RICE2015 1K3&3K3-I2031TransferCurves.png
Size of this preview: 800 × 553 pixels. Other resolution: 320 × 221 pixels.
Original file (2,208 × 1,525 pixels, file size: 42 KB, MIME type: image/png)
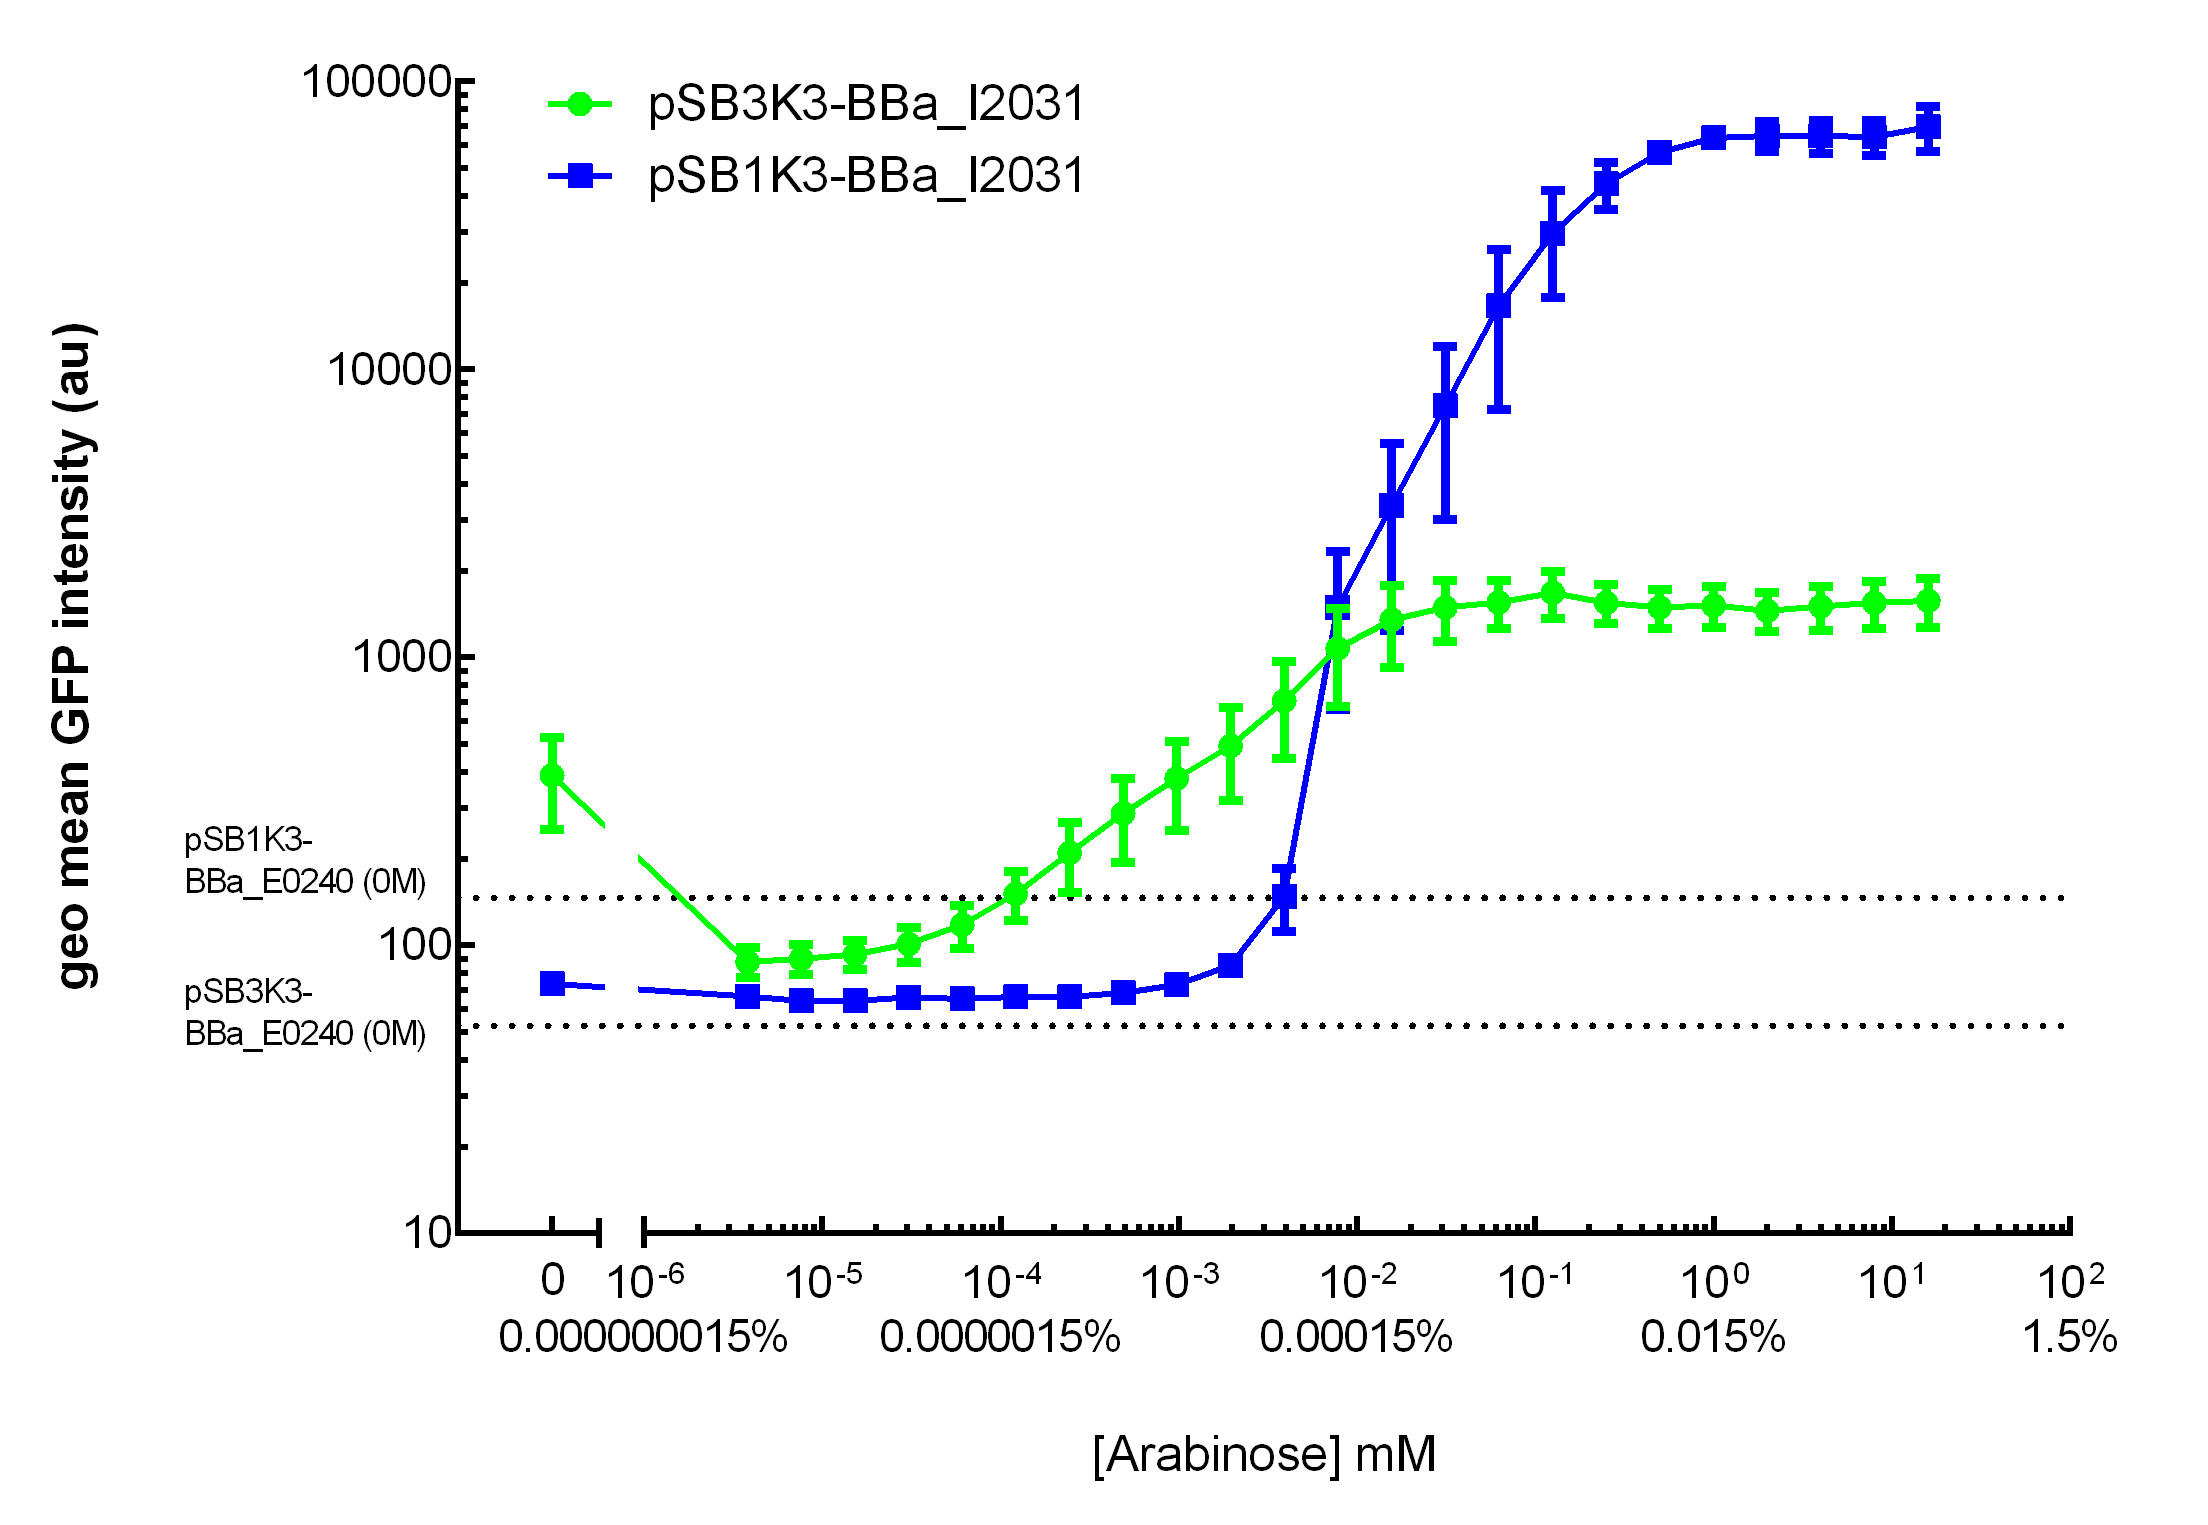
This figure shows the transfer curves for BBa_I2031 on plasmid pSB3K3 and pSB1K3. On pSB3K3, BBa_I0500 is responsive to 10-4 - 10-2 mM arabinose, whereas on pSB1K3, it senses arabinose from roughly 10-3 to 1mM. These data agreed with neither Cambridge 2011 nor Groningen 2011’s result. The dashed lines represent cells’ auto fluorescence, measured using DH10B cells harboring pSB3K3-BBa_E0240 or pSB1K3-BBa_E0240. Error bars represent SEM of 3 independent experiments on 3 different days. The molar concentration to percentage conversion was provided for comparison with previous data.
File history
Click on a date/time to view the file as it appeared at that time.
| Date/Time | Thumbnail | Dimensions | User | Comment | |
|---|---|---|---|---|---|
| current | 03:40, 17 September 2015 | | 2,208 × 1,525 (42 KB) | Hyht2011 (Talk | contribs) | This figure shows the transfer curves for BBa_I2031 on plasmid pSB3K3 and pSB1K3. On pSB3K3, BBa_I0500 is responsive to 10-4 - 10-2 mM arabinose, whereas on pSB1K3, it senses arabinose from roughly 10-3 to 1mM. These data agreed with neither Cambridge 201 |
- You cannot overwrite this file.
File usage
The following 2 pages link to this file: