
File:HKUST RICE2015 1K3&3K3-I2031HistogramsComparison.png
Size of this preview: 674 × 599 pixels. Other resolution: 270 × 240 pixels.
Original file (2,900 × 2,578 pixels, file size: 309 KB, MIME type: image/png)
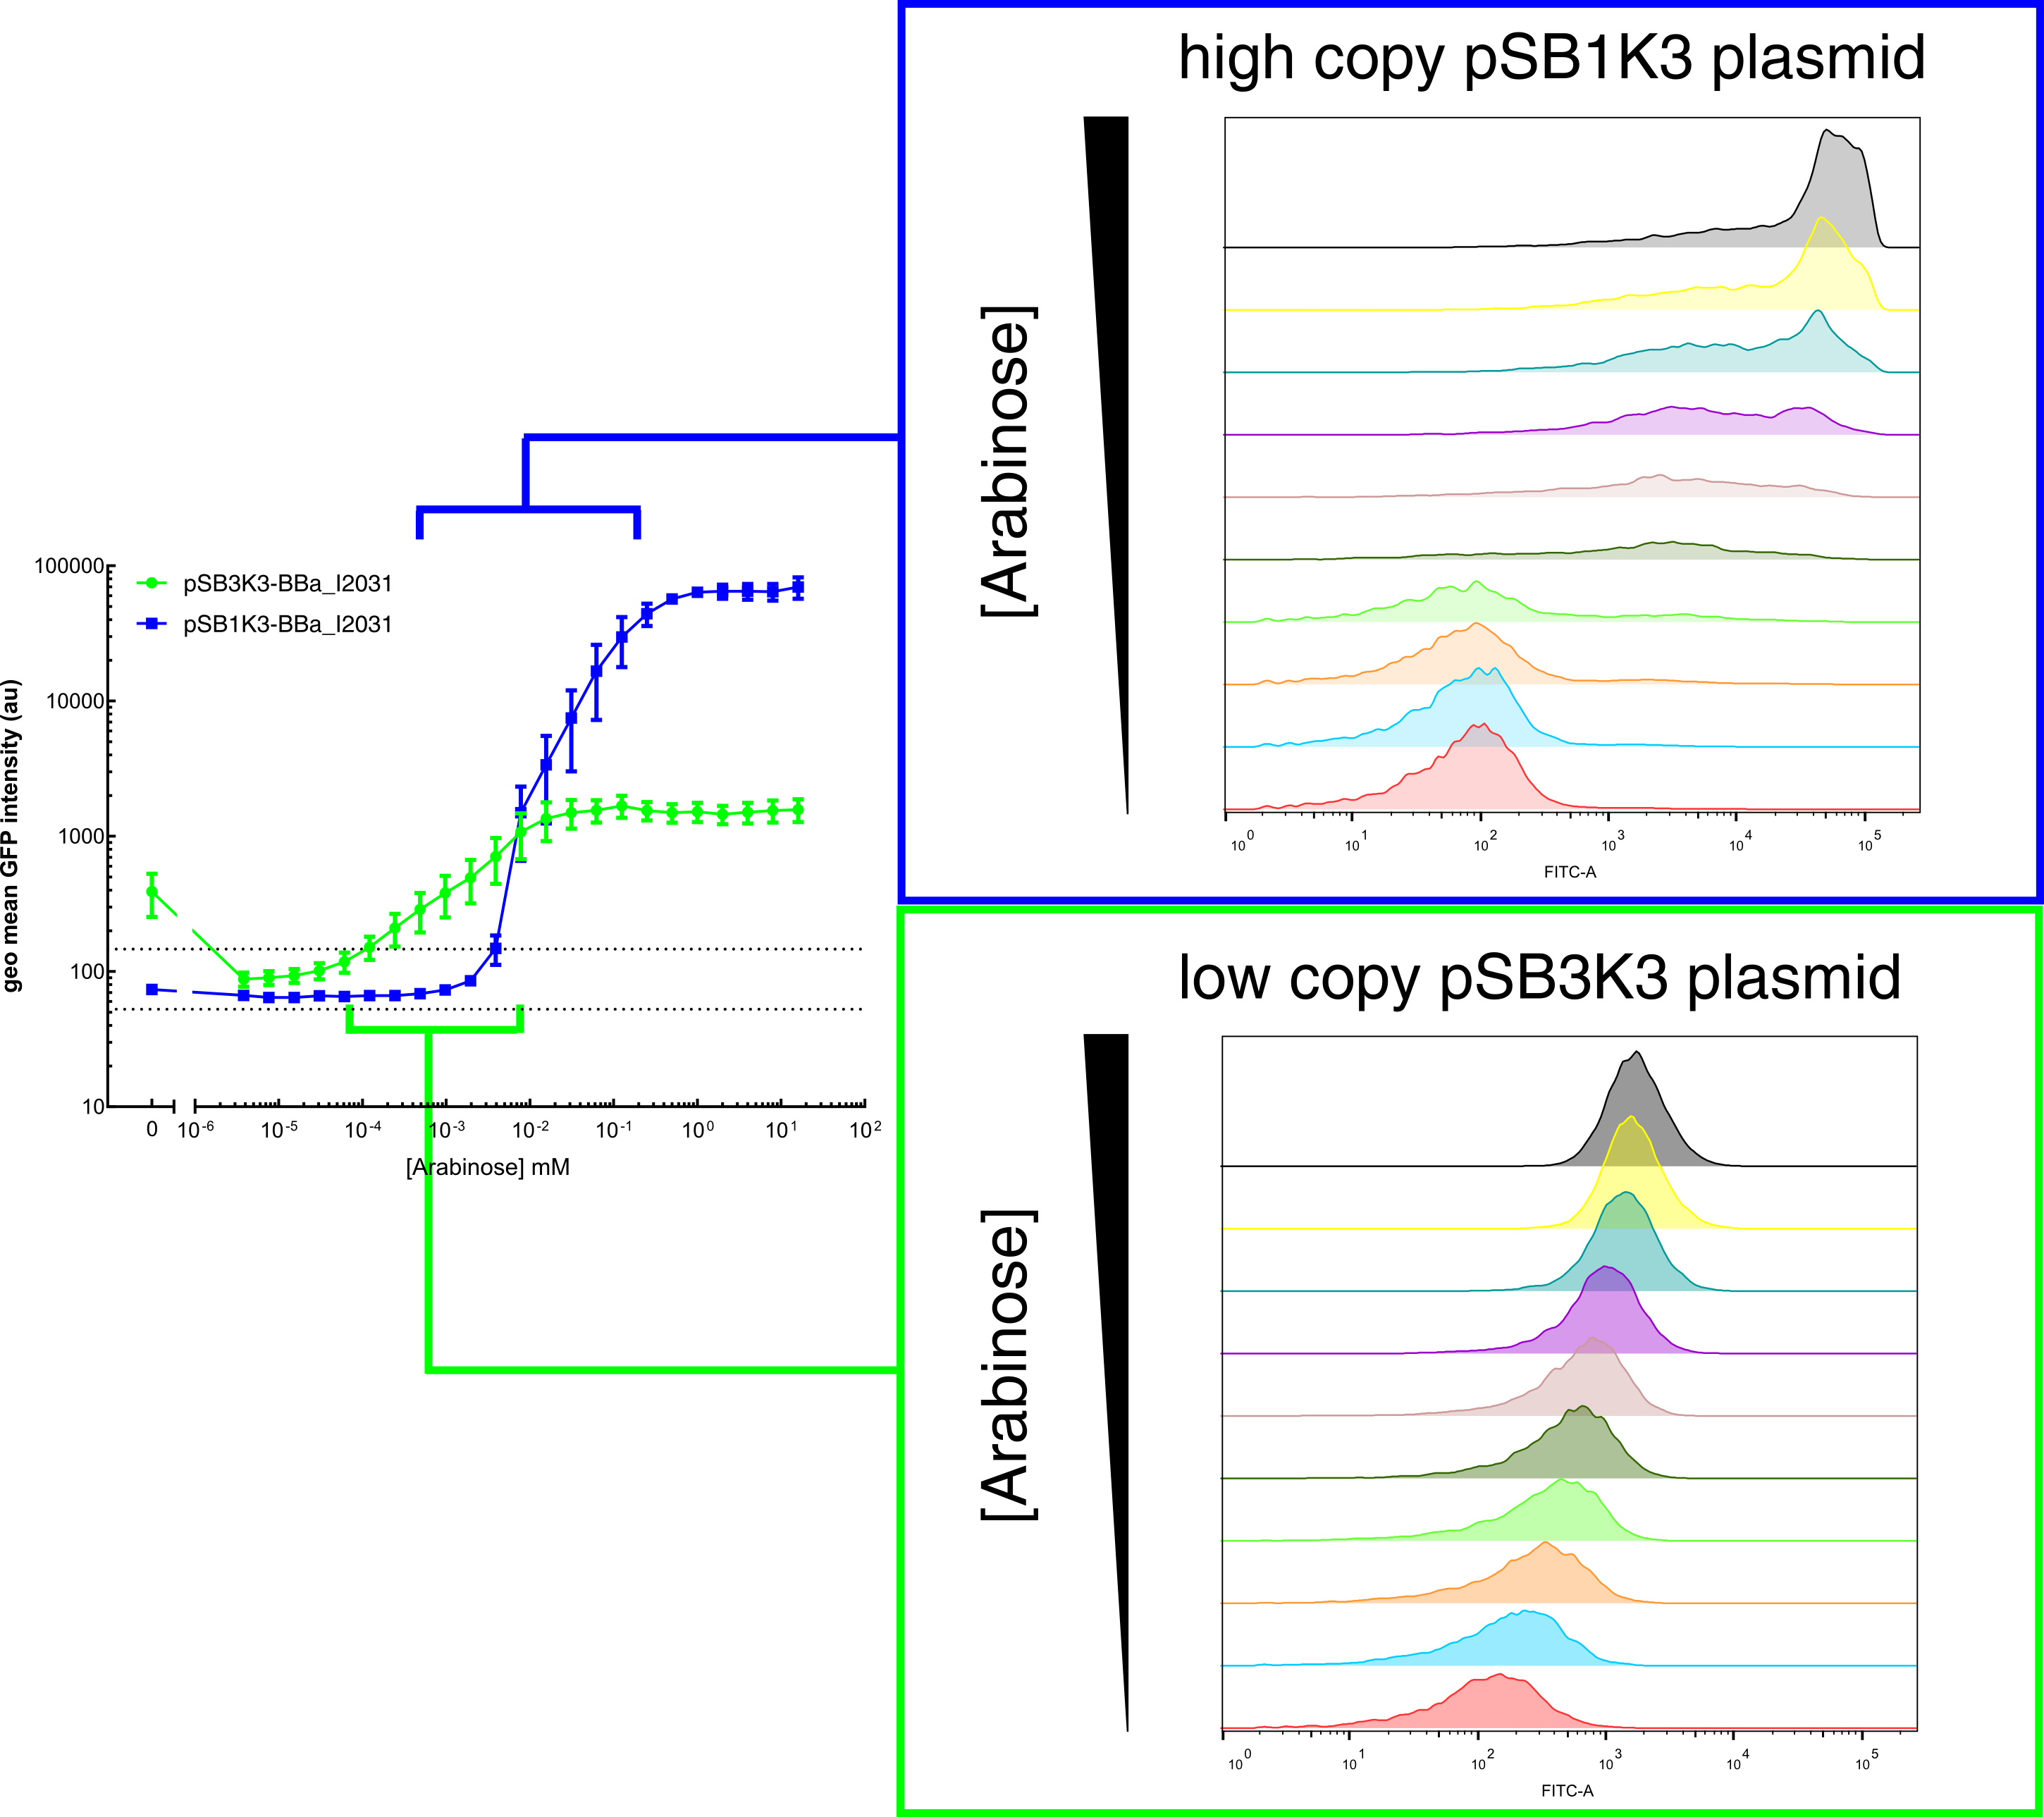
By HKUST-Rice iGEM 2015 This figure shows histograms plots for sensing ranges of BBa_I0500 on high and low copy plasmid. An all-or-none induction can be observed when BBa_I0500 is placed on a high copy plasmid, where induced cells were mostly distributed among two bins of fluorescence. Yet on low copy plasmid, the induced populations remain homogenous along the arabinose concentration gradient. Concentrations of arabinose for high copy pSB1K3 plasmid: 0.488µM – 0.25mM. For low copy pSB3K3 plasmid: 0.0610µM – 0.03125mM. Only 1 set of experiment result from 3 replicates is presented.
File history
Click on a date/time to view the file as it appeared at that time.
| Date/Time | Thumbnail | Dimensions | User | Comment | |
|---|---|---|---|---|---|
| current | 03:48, 17 September 2015 | | 2,900 × 2,578 (309 KB) | Hyht2011 (Talk | contribs) | By HKUST-Rice iGEM 2015 This figure shows histograms plots for sensing ranges of BBa_I0500 on high and low copy plasmid. An all-or-none induction can be observed when BBa_I0500 is placed on a high copy plasmid, where induced cells were mostly distributed |
- You cannot overwrite this file.
File usage
The following 2 pages link to this file: