
File:Esta autotransporter real.png
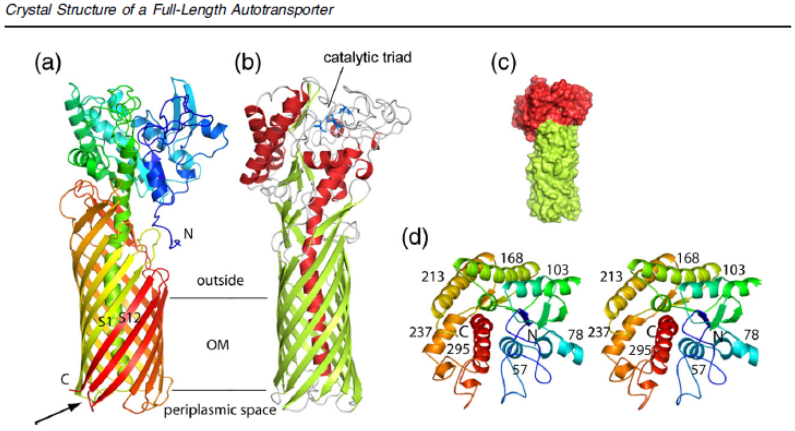
Fig. 1. Overall structure of the full-length EstA AT. (a) Backbone representation viewed from the side, with the protein colored by a gradient from blue at the N-terminus to red at the C-terminus. Strands S1 and S12 are indicated, with an arrow highlighting the connection between the central α-helix and strand S1. (b) Backbone view 90° rotated within the plane of the membrane relative to (a), with helices colored red, β-strands colored green, and loops colored gray. The catalytic triad residues are shown as blue stick models. The approximate location of the OM core is indicated by horizontal lines. (c) Surface view of EstA from the side, with the β-barrel domain colored green and the passenger domain colored red. (d) Stereo view of the EstA passenger from the extracellular side, colored as a rainbow from dark blue at the N-terminus to dark red at the C-terminus. The numbers are those for the central residue of the α-helix. For clarity, the loops have been smoothed. All figures were made using PyMOL.18
File history
Click on a date/time to view the file as it appeared at that time.
| Date/Time | Thumbnail | Dimensions | User | Comment | |
|---|---|---|---|---|---|
| current | 00:31, 20 October 2011 | | 795 × 431 (328 KB) | Sorensera (Talk | contribs) | Fig. 1. Overall structure of the full-length EstA AT. (a) Backbone representation viewed from the side, with the protein colored by a gradient from blue at the N-terminus to red at the C-terminus. Strands S1 and S12 are indicated, with an arrow highlighti |
- You cannot overwrite this file.
File usage
The following page links to this file: