
File:Degradation tags-steady state.png
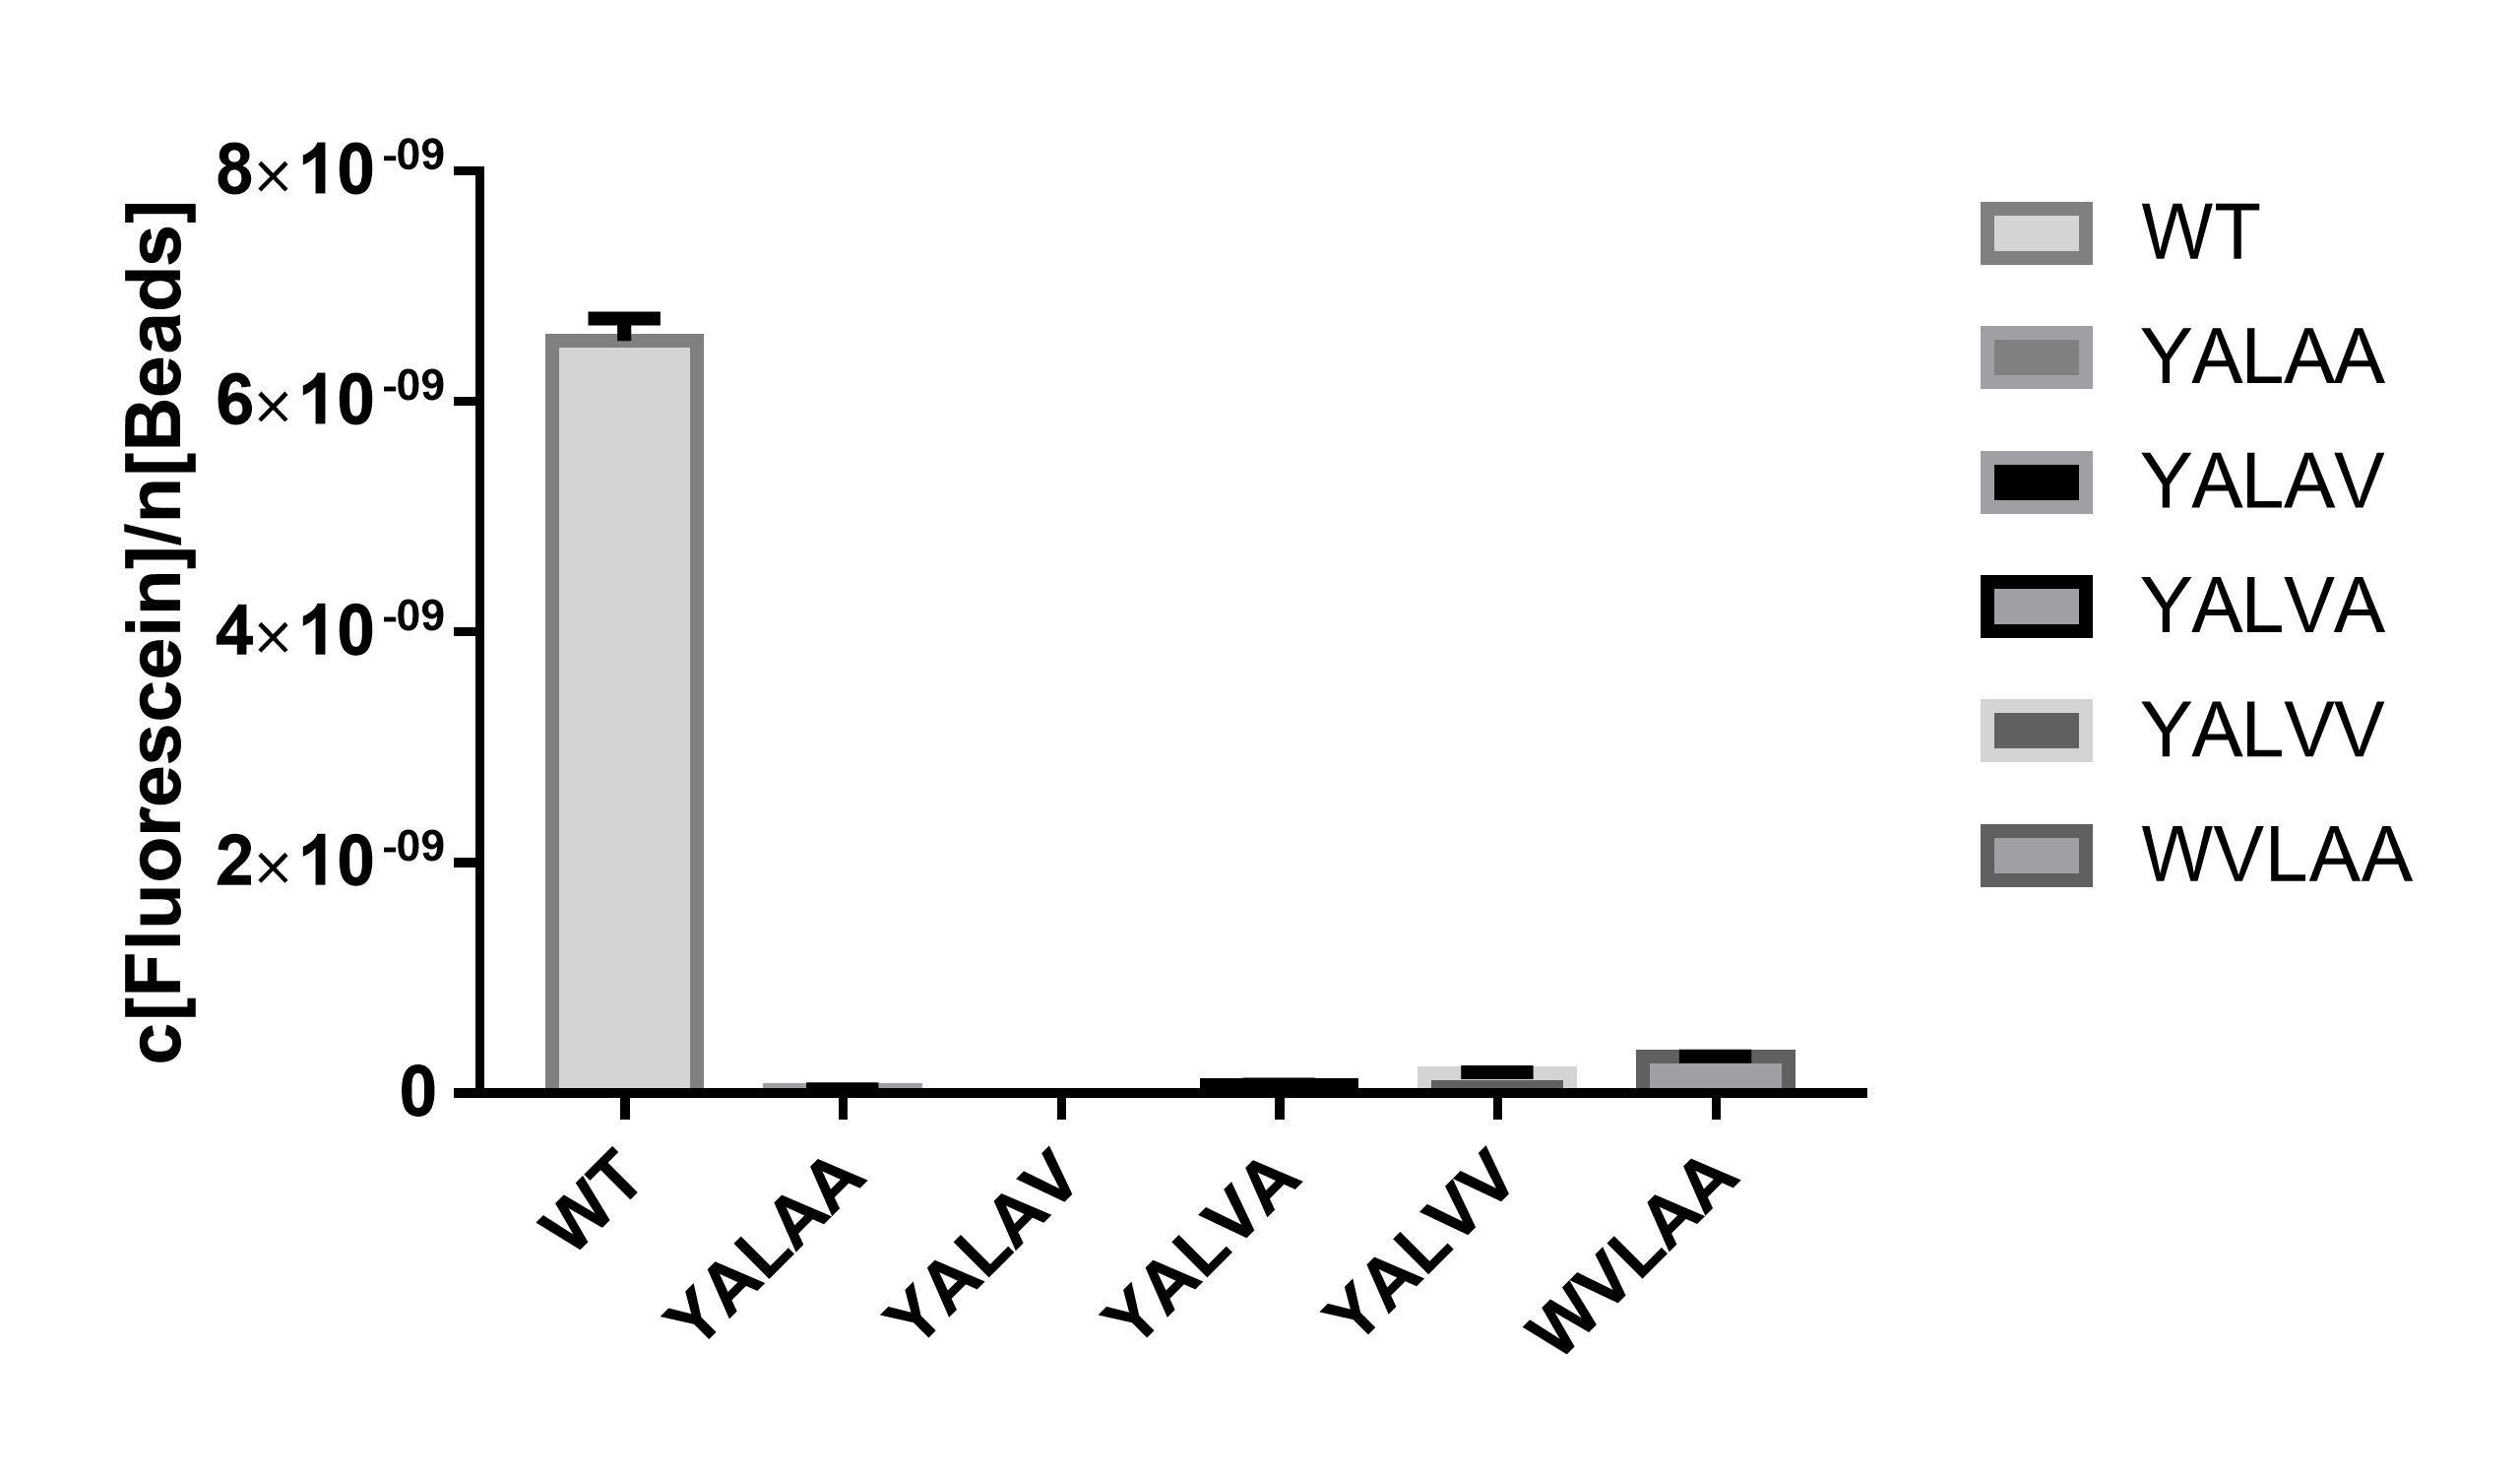
Figure 1. Degradation tag greatly reduces the protein level at stable state. WT represents the positive control of EGFP without any tag attachment. The five degradation tags are represented by their last five amino acid sequence. The vertical axe shows the quantitative analysis of EGFP fluorescence (excitation wavelength: 485 nm; detection wavelength: 528 nm), normalized by cell amount (OD600). The fluorescence is quantified by the concentration of green fluorescein, cell number is quantified by the number of silicon beads, both are from the distributed measurement kit. Fluorescence below detection level are eliminated. Error bar stands for the SEM of 3 replicates. t-test is performed between WT and each degradation tag, P<0.0001 (****).
File history
Click on a date/time to view the file as it appeared at that time.
| Date/Time | Thumbnail | Dimensions | User | Comment | |
|---|---|---|---|---|---|
| current | 03:06, 18 October 2019 | | 2,560 × 1,501 (103 KB) | YY12138 (Talk | contribs) | Figure 1. Degradation tag greatly reduces the protein level at stable state. WT represents the positive control of EGFP without any tag attachment. The five degradation tags are represented by their last five amino acid sequence. The vertical axe shows... |
- You cannot overwrite this file.
File usage
The following 10 pages link to this file: